
Monitor SCCM Client Data Sources
Founder of System Center Dudes. Based in Montreal, Canada, Senior Microsoft SCCM Consultant, 8 times Enterprise Mobility MVP. Working in the industry since 1999. His specialization is designing, deploying and configuring SCCM, mass deployment of Windows operating systems, Office 365 and Intune deployments.

Benoit Lecours
PresidentTable of Content


Share


Get the latest insights and exclusive content delivered to your inbox
In the latest SCCM version, SCCM clients can get their content from various new sources when you deploy software and software updates to your clients.
Client can get their content from :
- Distribution points
- Cloud distribution point
- BranchCache
- Peer Cache
- Delivery Optimization (SCCM 1906+)
- Microsoft Update
You’ve probably put much effort into configuring these different options. But how can you easily monitor SCCM Client Data Sources? How can you validate that your clients are really getting their content from where it should.
There’s various way in SCCM to better understand where clients get content in your environment. This post will shows in detail how to see SCCM Client Data Sources results.
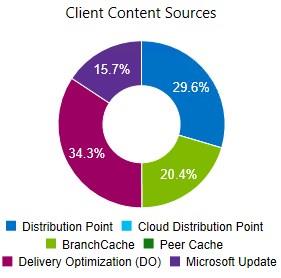
SCCM Client Data Sources dashboard
The SCCM Client Data Sources dashboard in the console is one way to do it.
The dashboard starts displaying data when clients download content and report it back to the SCCM site.
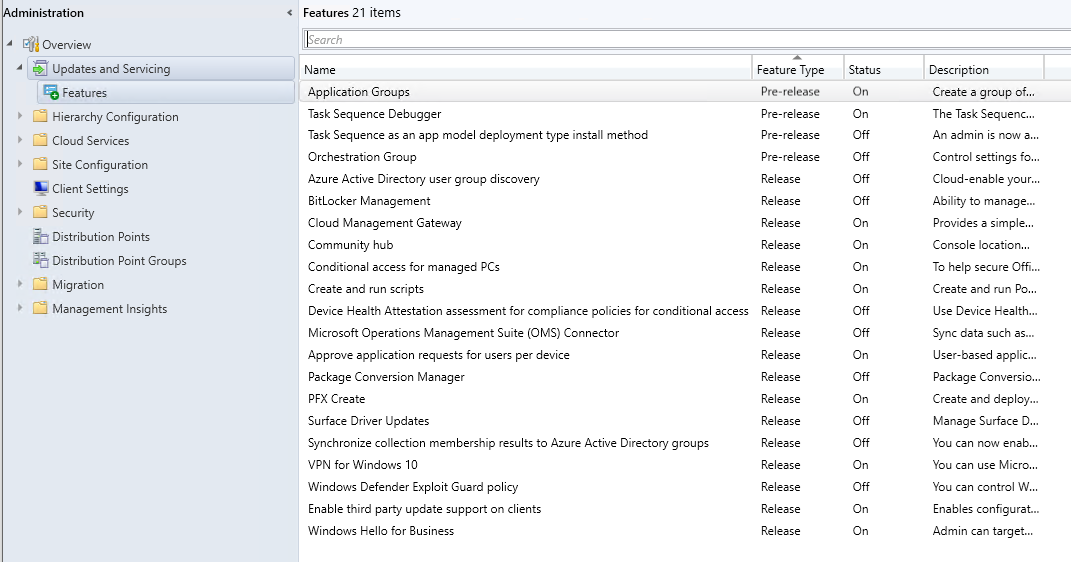
Before using the Dashboard, ensure that you enable the Client Peer Cache feature if you’re using an older SCCM version. In the latest SCCM version 2006, the Client Peer Cache option is no longer listed in the optional feature.
To verify :
- In the SCCM Console
- Go to Administration \ Updates and Servicing \ Features
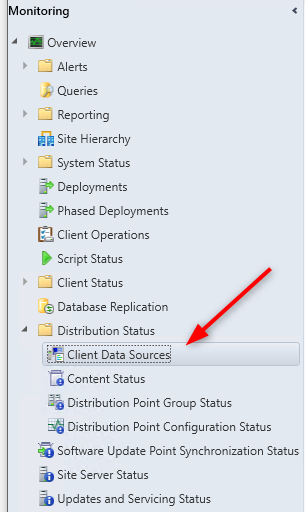
Once verified, you can heads up to the SCCM Client Data Sources dashboard.
- Go to Monitoring \ Distribution Status \ Client Data Sources
- At the top of the Dashboard, you can filter the results based on time or boundary group
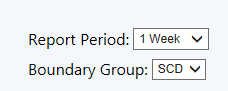
- Once selected, the results are displayed

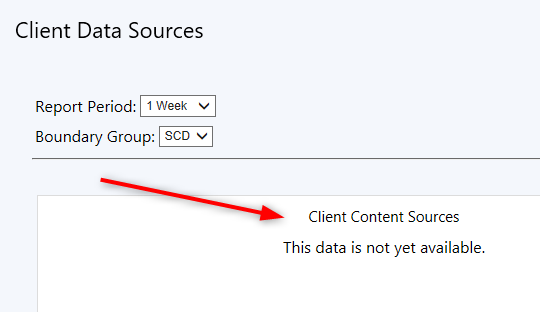
- If the chart is displaying This Data is not yet available, head back up to the requirement section. If all requirements are met, maybe it’s just a matter of time. Data can take up to 24H to first show up.
- From there, there’s not much more you can do. The numbers and chart can’t be drilled down to have more details. This is unfortunately the case of many Dashboard in the SCCM console.
SQL Query
Another option is to query directly SQL using SSMS. This one is a bit tricky since the Client Data Source data is not stored in a SQL view. It’s stored in a Stored Procedure.
There’s 2 Stored Procedure to get data :
Before using the procedure you need to know that the first parameter is the Boundary Group ID (@iBoundaryGroupID), and the second is for the time (in days – @iReportedDays)
Query #1 – List by Content and number of bytes
DECLARE @iBoundaryGroupID INT = (select GroupID from BoundaryGroup where Name like ‘%Boundary Group Name%’);
DECLARE @iReportedDays INT = 30;
exec [dbo].[spClientDataSourcesContentStats] @iBoundaryGroupID, @iReportedDays
Query #2 – Number of Sources and clients :
DECLARE @iBoundaryGroupID INT = (select GroupID from BoundaryGroup where Name like ‘%Boundary Group Name%’);
DECLARE @iReportedDays INT = 30;
exec [dbo].[spClientDataSourcesDeviceCounts] @iBoundaryGroupID, @iReportedDays
Using our Free SCCM Client Data Source Power BI Dashboard
The last option is to use our Free SCCM Client Data Source Power BI Dashboard which will show the data in a much more sexy way.
A full list of features is available on our product page or you can look at the full video to see it in action.
You can download it free from our shop. Let us know how you like it !
Share
Get the latest insights and exclusive content delivered to your inbox


alodaohan
11.13.2020 AT 03:32 AM