Beginning with SCCM/MEMCM 2002, it’s possible to Integrate Power BI Report Server to an existing Reporting Point or to a site that doesn’t have a reporting point installed. Doing so will give you the ability to manage your Power BI Dashboard the same way you manage your SSRS report. All done directly from the console makes it easier to deploy and edit your existing dashboard and to create a new one.
You may already use many SSRS reports to monitor and visualize your SCCM data. Microsoft has released Power BI a couple of years ago and has its advantage over SSRS
System Center Dudes team has decided to develop a series of Power BI dashboard. We think that, if you have the skills, the visualization of your SCCM data should be done using Power BI.
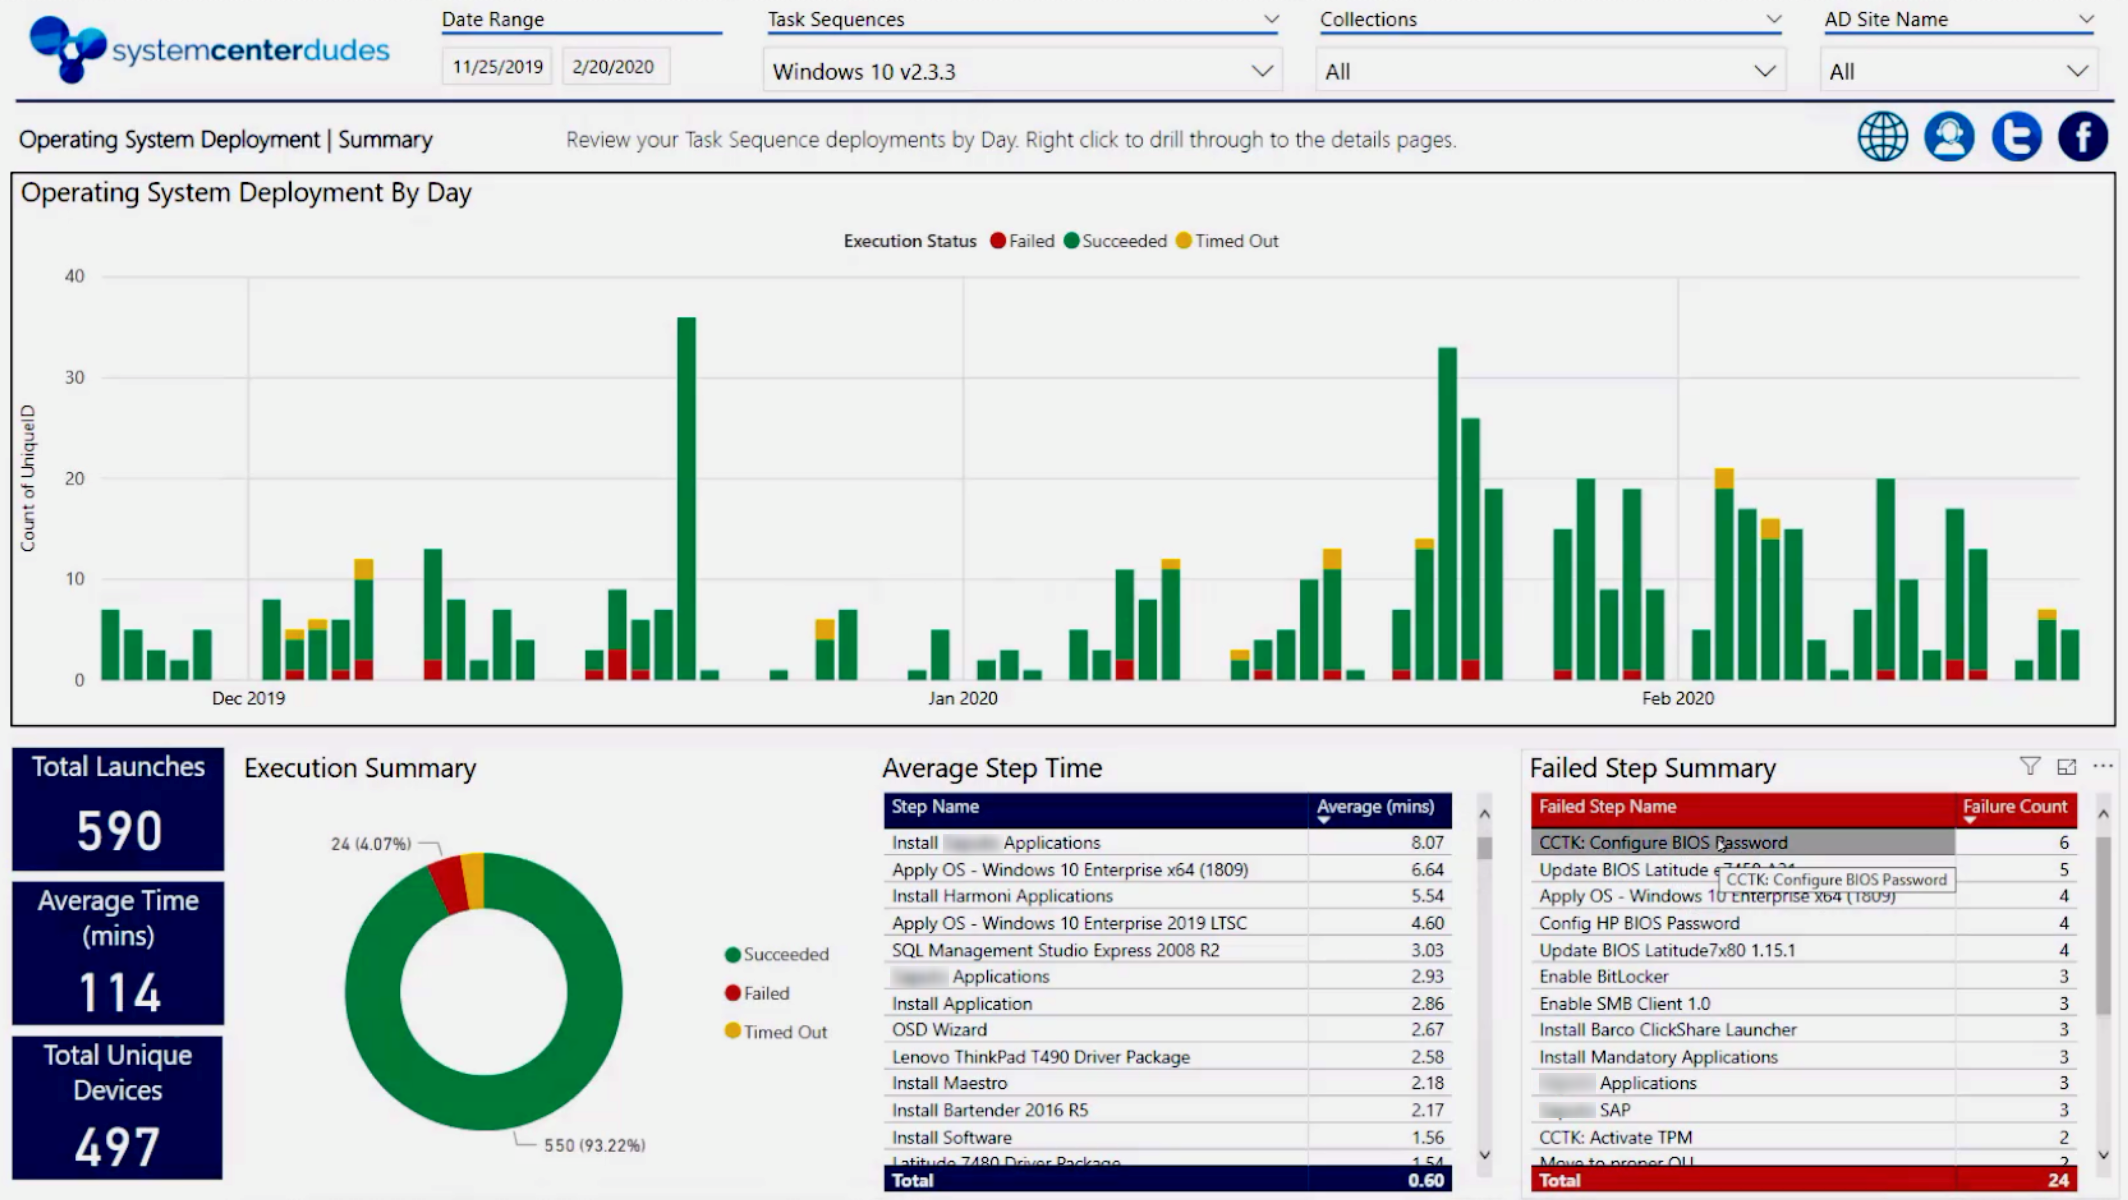
So… you’re ready to give this a try but are unsure where to start? We got you covered! This blog post will describe how to create your first SCCM Dashboard with Power BI Desktop.
The tool needed to develop a Power BI dashboard is the Power BI desktop. We assume that you already have a fully functioning SCCM server.
We will start by installing Power BI Desktop on a computer:


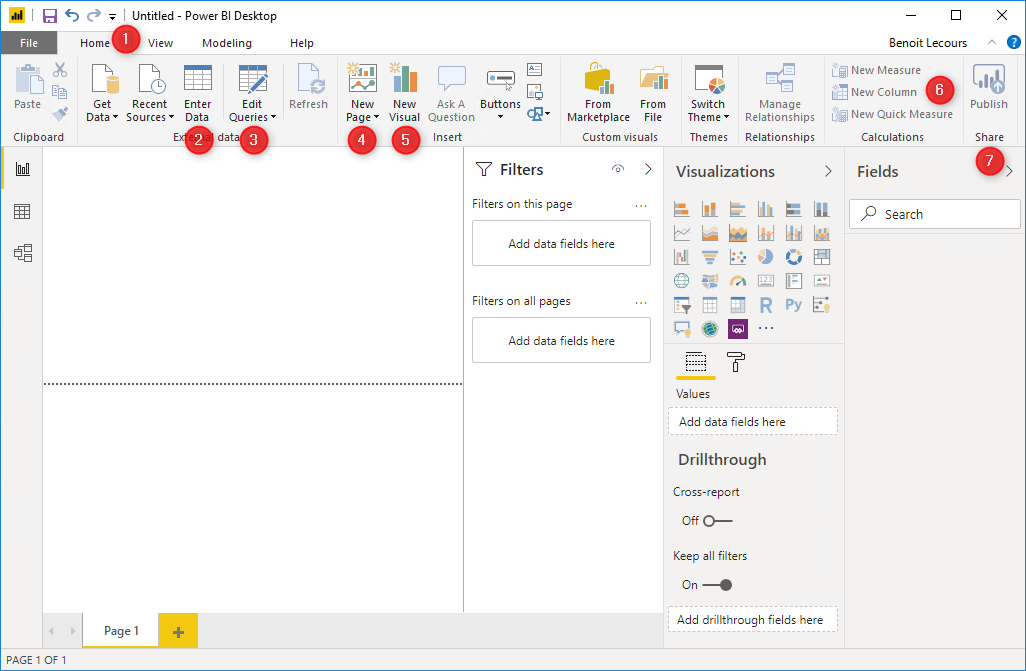
Once you launch Power BI Desktop, at the top of the page is a ribbon of various tabs. The Home (1) tab provides various common functions. You can get new data (2), edit your current data (3), add new pages (4), visuals, or objects (5), create new measures and columns (6), or publish your report to Power BI on the internet. (7)
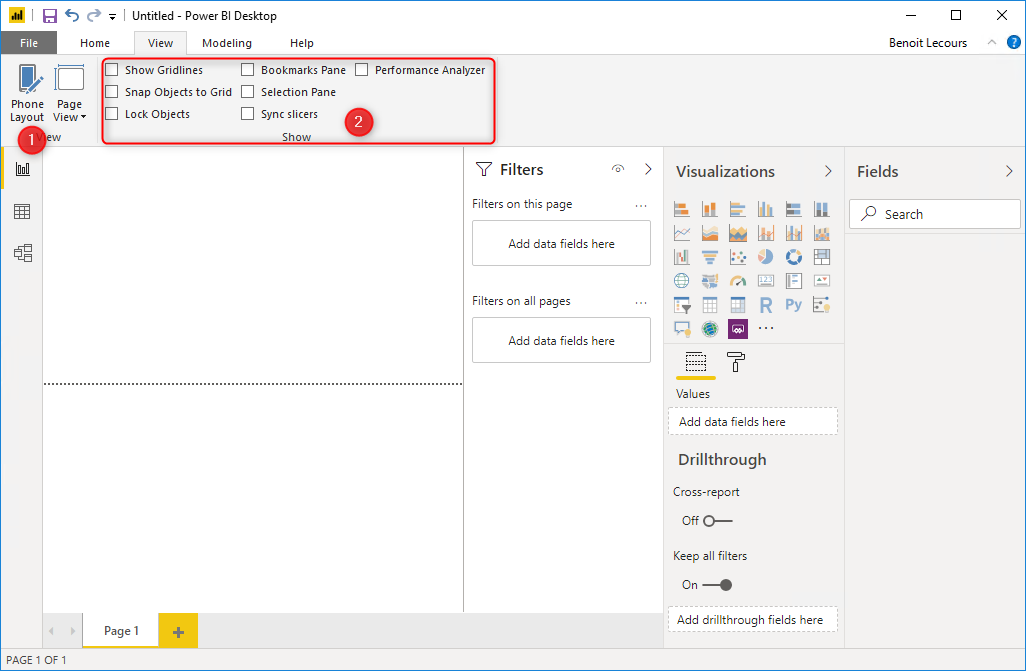
The View tab allows you to change from Desktop View to Phone View (1) or make other adjustments to the view settings. (2)
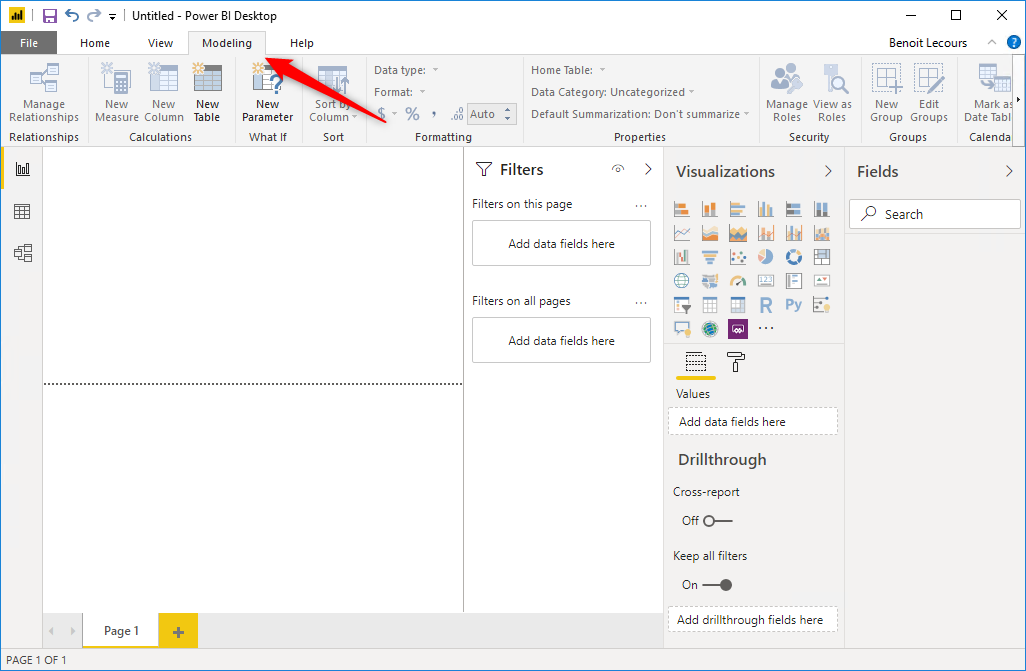
The Modeling tab allows you to manipulate the data you’ve imported to Power BI.
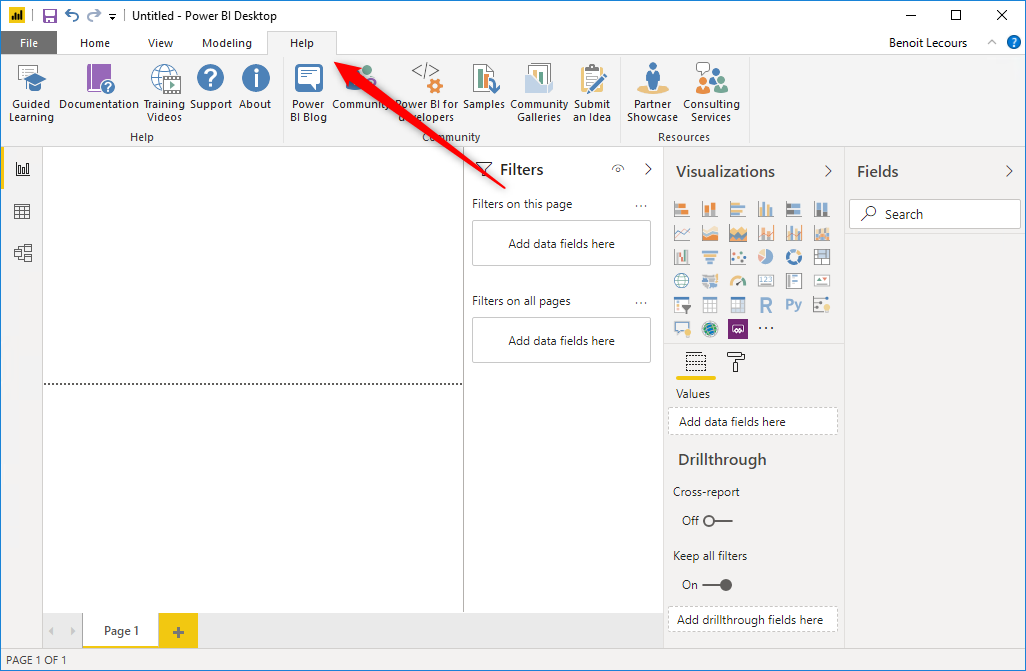
The Help tab offers links to a variety of Power BI help and training materials.
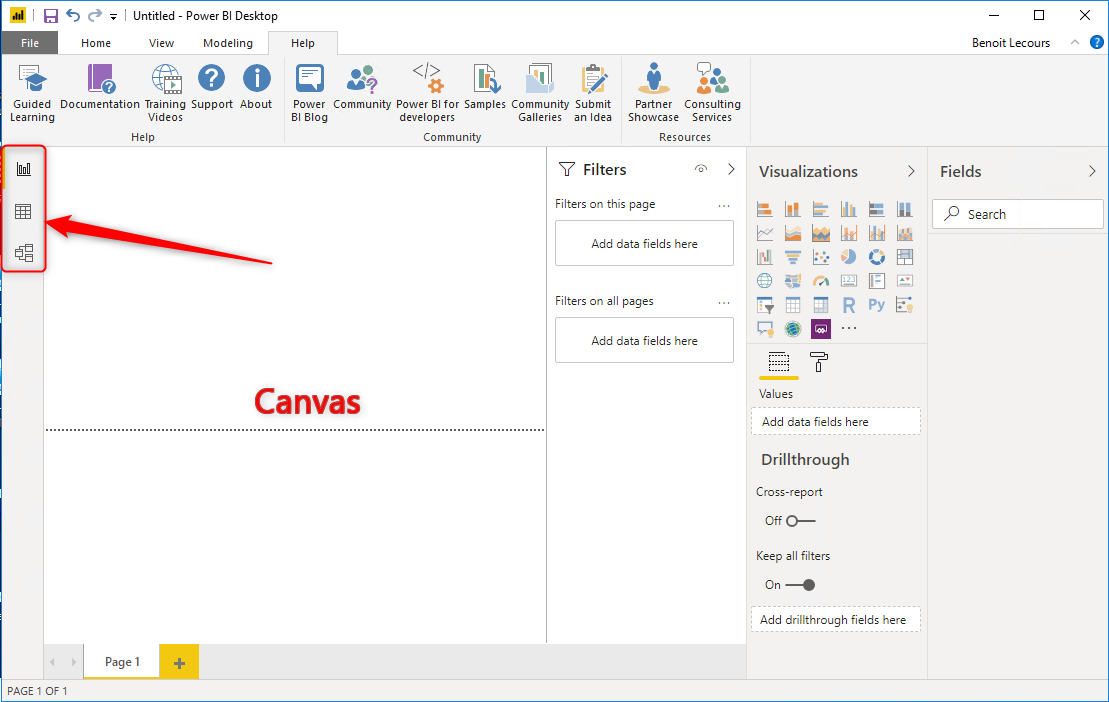
Below the ribbon, we can see three icons on the left side of the screen.
These icons are used to switch between the three options for viewing our data in Power BI Desktop. The default view is Report View, and the white space is called the Canvas. This is where we’ll build the visualizations that make up our Power BI reports.
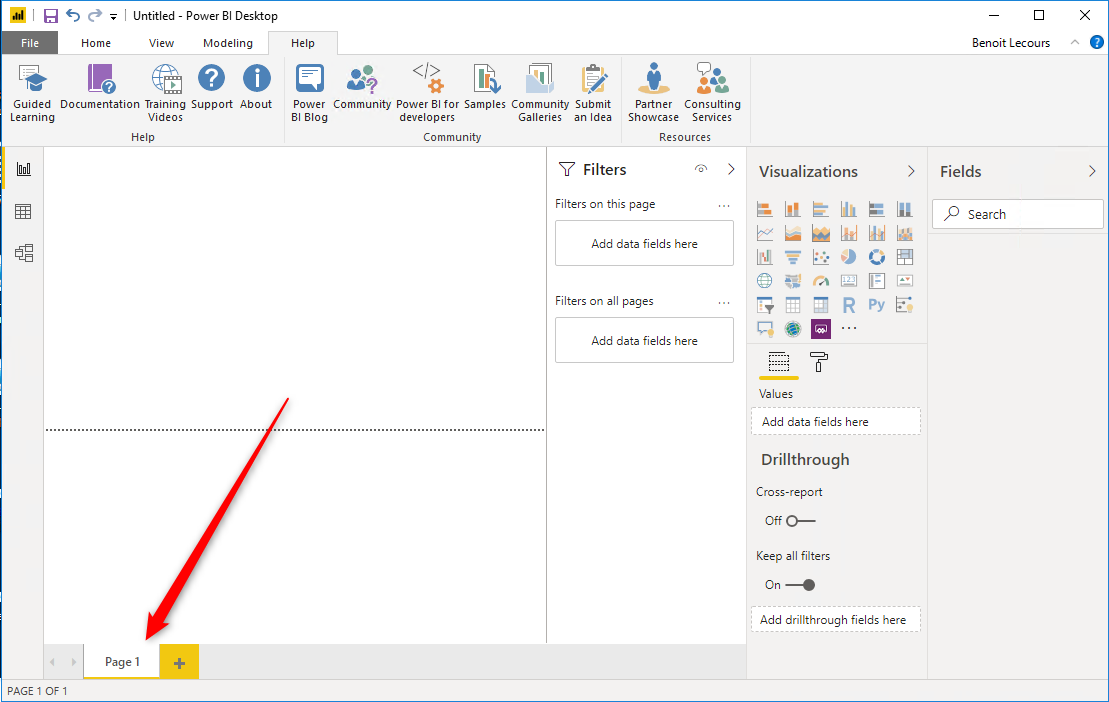
At the bottom of the report are the page controls. Here, we can add new pages, delete existing ones, or rename pages by double-clicking on the title.
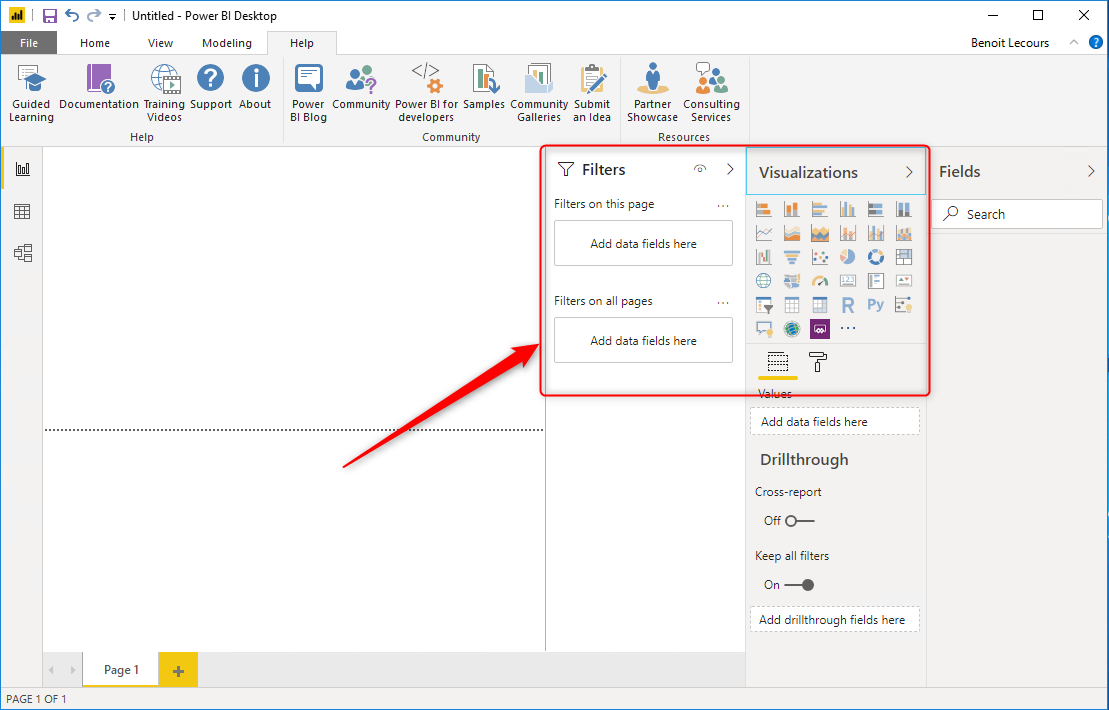
On the right, you have Filters and Visualizations options. We’ll come back to this later on this post.
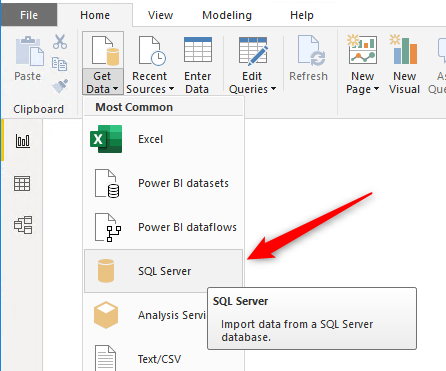
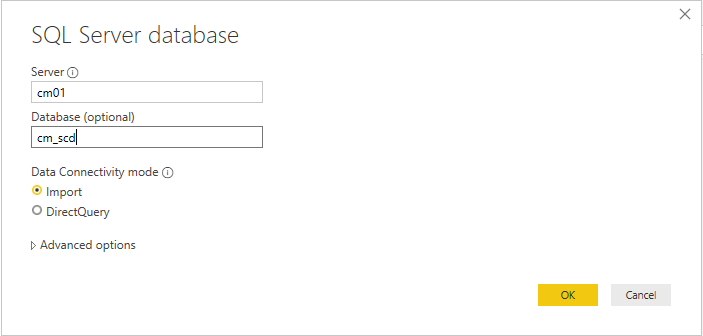
Now that you’re comfortable with the UI, we can link our SCCM SQL server which is the first step to start building your dashboard.
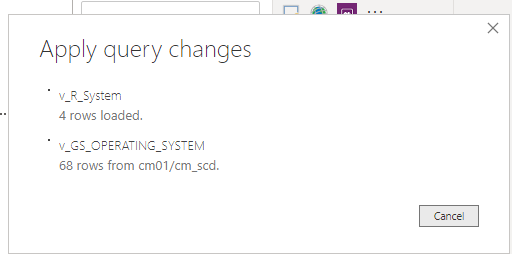
We will now, edit our query to remove unneeded data.
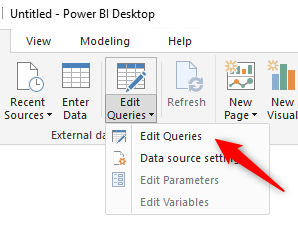
In this screen, you can “play” with the data. You can remove unwanted data. In our example, we will remove 2 complete columns. On the left, you can undo your action and see what steps have been applied.
The fun part of building your dashboard can now begin. We’ll create a pretty basic dashboard Dashboard. The goal is more to make you understand how easy it is to build.
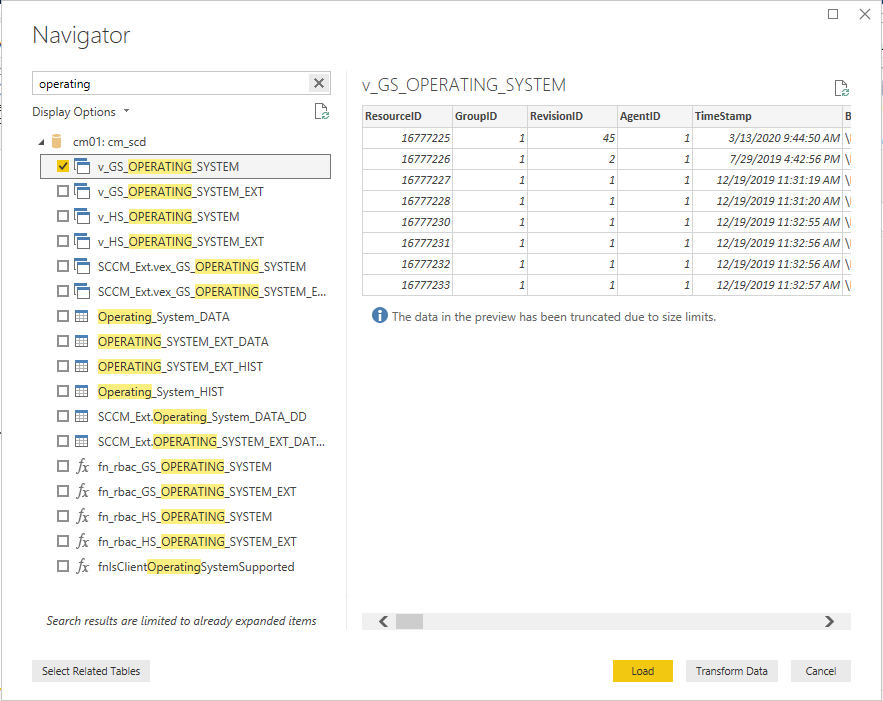
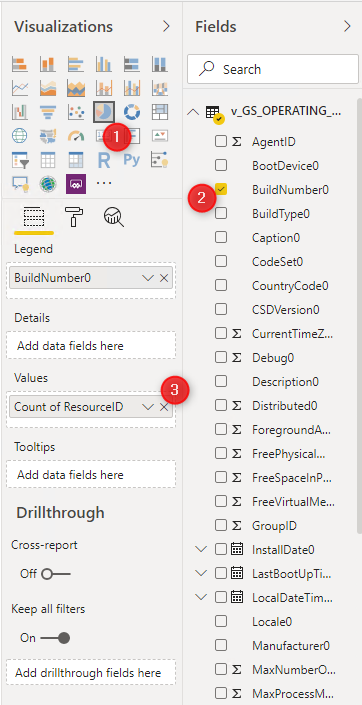
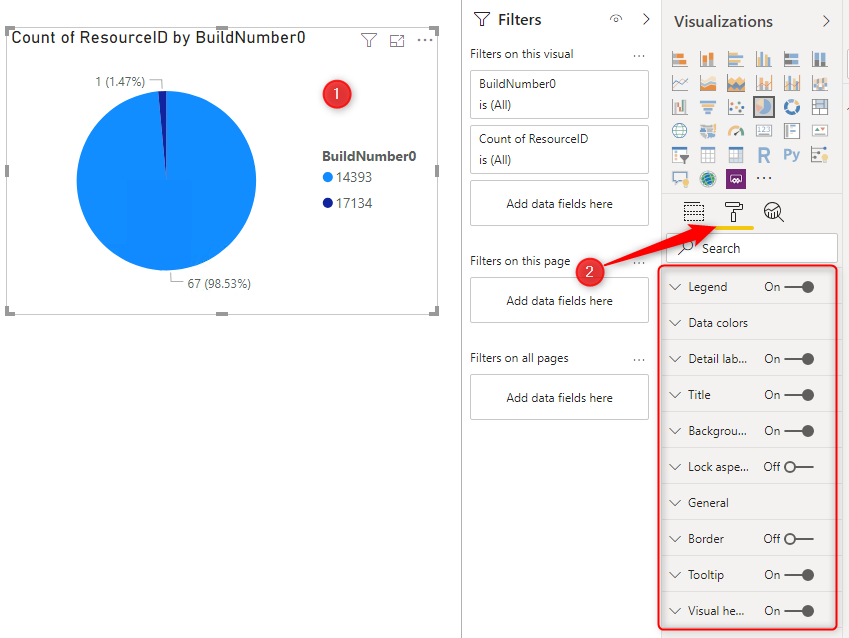
On the right part, you’ll find the views you just imported. You can select the needed field and the data will appear on the Canvas. You can change between charts, tables, sliders, maps, gauges, and other visualization types.
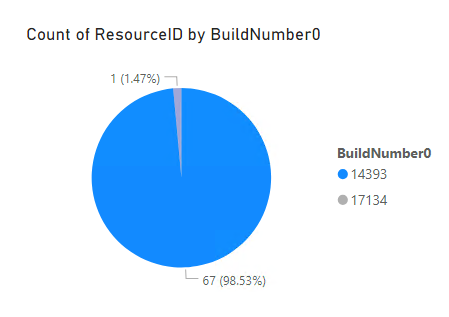
In our example, let’s begin with a chart of the OS Build Numbers.
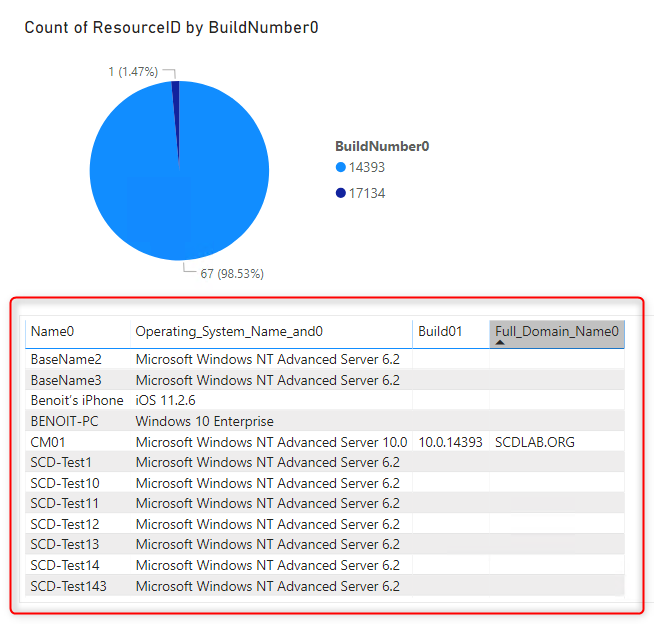
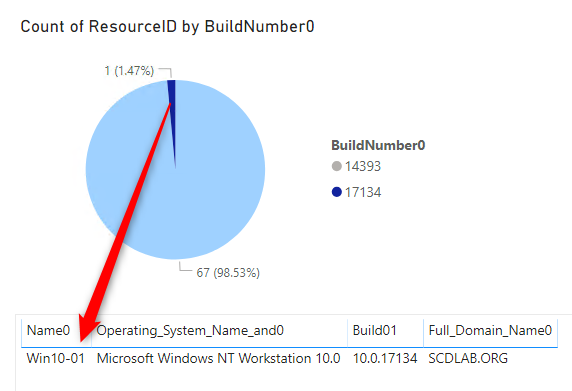
Now, let’s create a table to list the device identified by the pie chart.
From there, your imagination is the limit. Let’s say we want our device count displayed. Let’s try that using Q&A visualization type :
Or final Dashboard looks like this :
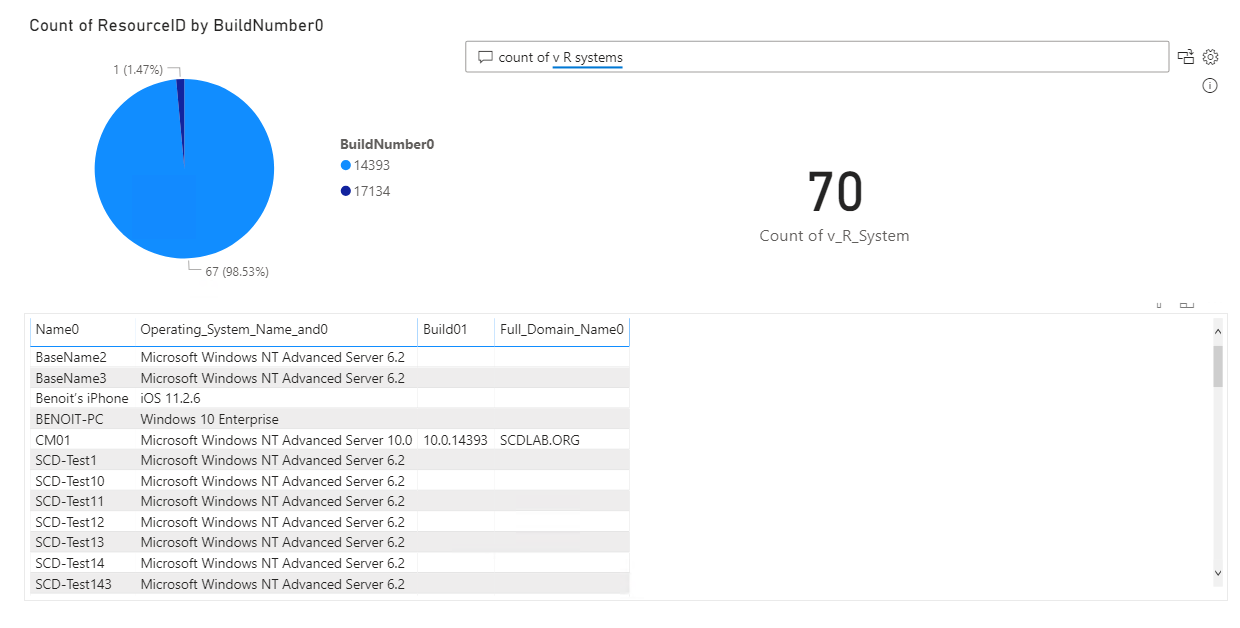
It’s pretty basic for now but it has been created in less than 5 minutes. It’s pretty simple to add more data. From there your imagination is the limit. The tough part is to make it look good visually as too much data may be difficult to read. Please share your best SCCM PowerBi Dashboard Creation!

Please fill out the form, and one of our representatives will contact you in Less Than 24 Hours. We are open from Monday to Friday.

Thank you for subscribing to our newsletter or requesting a quote. You will receive our next month's newsletter. If you have requested a quote, we will get in touch with you as soon as possible.

Something went wrong!

Thank for your reply!