Download and own the latest version of this SCCM Cloud Management Gateway Installation Guide in a single PDF file.
The guide was recently updated to cover the latest method of building a Cloud management Gateway with the VM Scale set. The below information cover the CMG with Cloud Service (classic) which will be retired in Q1 2023.
The PDF file is a 50 pages document that contains all information to install a cloud management gateway with SCCM. Use our products page or use the button below to download it.
We can also set up a Cloud Management Gateway for your organization through our consulting services. See our Fixed Price Plan page to see our prices.
The ConfigMgr team is working really hard to make SCCM admins job easier for some of the key components of Modern Management. Starting with SCCM 1806 release, they ease a bit the setup of the SCCM Cloud Management Gateway (CMG).
If you are new to the concept of SCCM Cloud Management Gateway, the main advantage is that it doesn’t expose your SCCM servers to the internet. The downside is that it requires an Azure subscription which brings recurring monthly costs. If you’re still unsure which method to use, you can read the Microsoft documentation and see our blog post about internet client management. Make sure that you understand the limitation of using internet clients.
We strongly encourage to use the SCCM Cloud Management Gateway if you’ll be managing client on the internet since this feature will evolve with time and the traditional way support should go away.
January 2021
This post has been updated to reflect recent addition with SCCM 2010 release.
The main new feature is Token-based authentication for clients.
Also added more tips and tricks to ease implementation
If you are not yet running SCCM 1806, but still would like to use Cloud Management Gateway, see our previous post
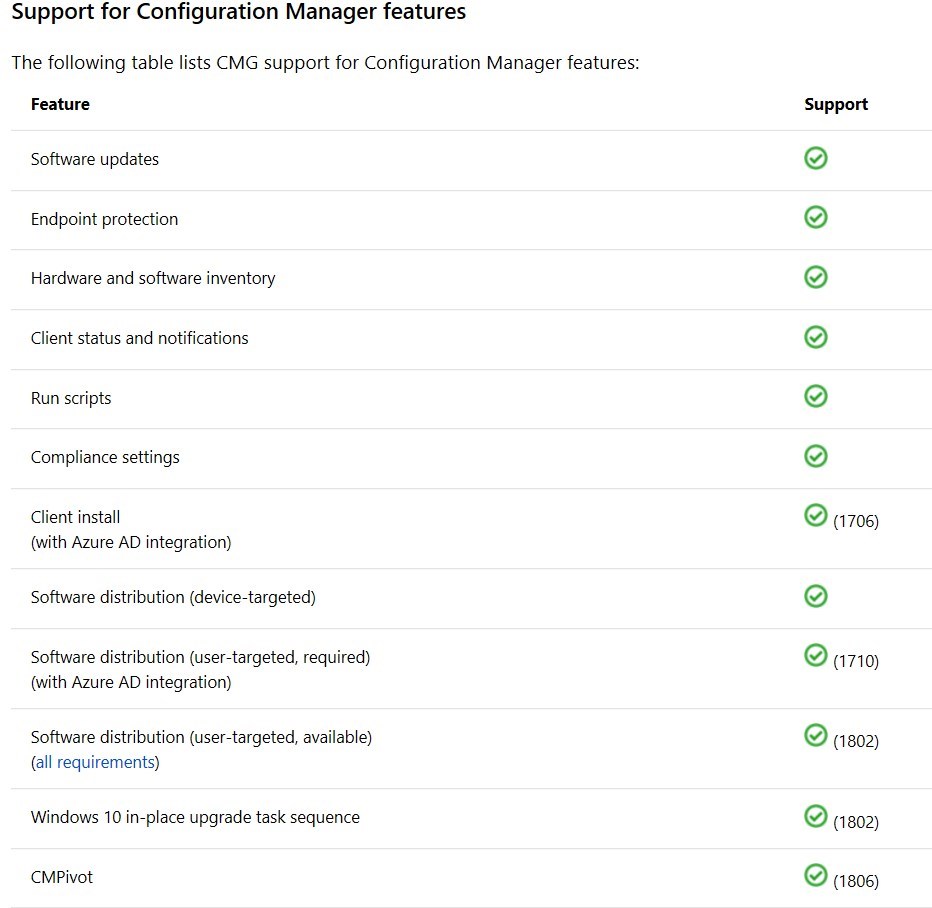
Here the available features supported through the Cloud Management Gateway:
In this post, we will configure an SCCM Cloud Management Gateway by using the Azure Resource Manager.
Some sections from our previous post are brought back here to ease reading.
SCCM CMG High-level steps
All steps are done directly in the SCCM console and from the Azure Portal. We will describe each step:
Configuring the Cloud Management gateway with SCCM 1806 remove the requirement of an Azure Management certificate
Verify a unique Azure cloud service URL
We don’t need to create the cloud service in Azure, the Cloud Management Gateway setup will create the service. We just need to verify that the Azure cloud service URL is valid and unique.
In the Azure Portal, select Cloud Services on the left, click Add
Enter the desired DNS name
Validate that there’s a green checkmark on the right. If your name is not valid, a red X will display, choose a different name if it’s the case
Once your name is valid, take note of the name as it will be needed later. We will use SCDCMG as DNS Name for our example
Close the window, do not create the service now
Verify Azure subscription’s Resource Provider
This is not documented in the official Cloud Management gateway docs from Microsoft, but 2 resource providers are now defaulted to Not Registered for newer Azure Subscription. To validate the status, follow these steps
Log in the Azure portal
In the Azure Portal, select Cost management and billing
Click on Cost Management and select Go to subscription
If you see multiple subscriptions, select the one that will host the Cloud Management Gateway
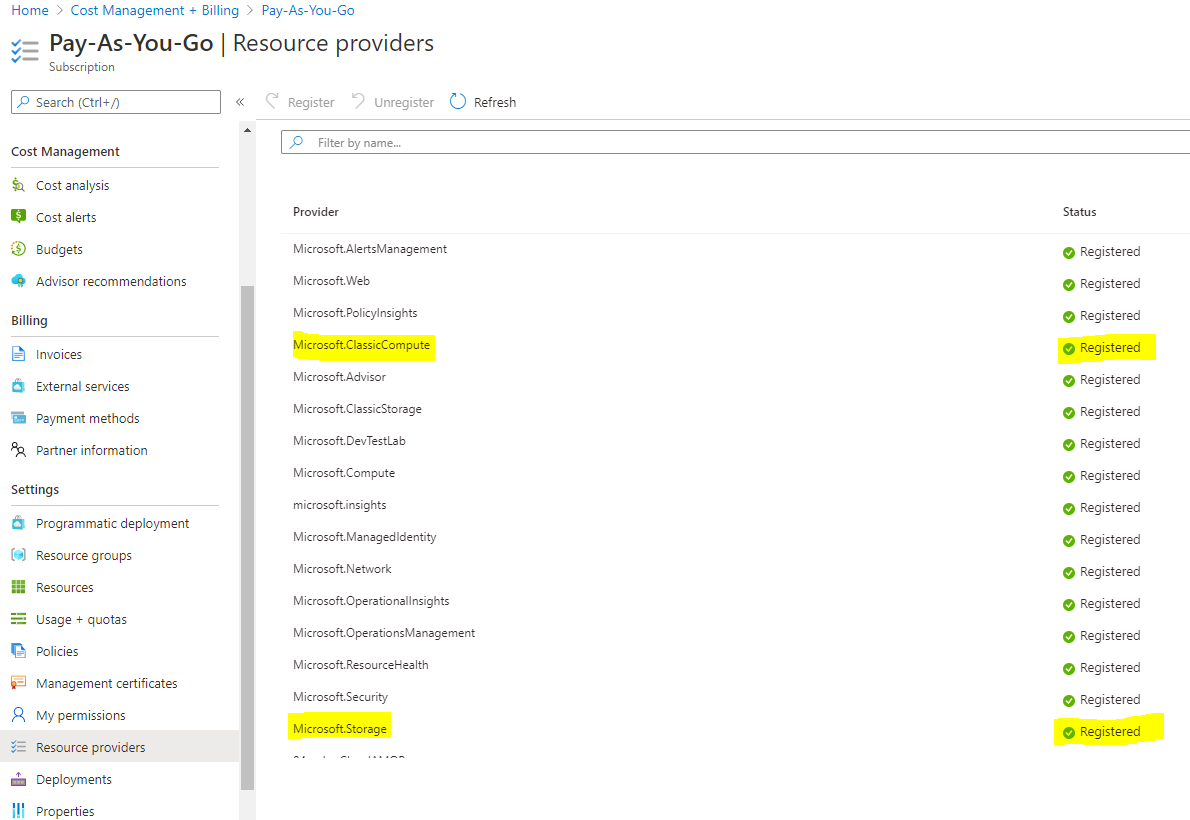
Under the section Settings, select Resource Provider
Make sure Microsoft.ClassicCompute and Microsoft.Storage are registered. If not, select one and click on Register
Configure the Azure Service – Cloud Management
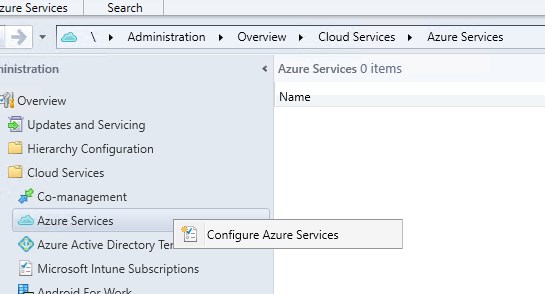
Go to Administration/Cloud Services/Azure Services and select Configure Azure Services
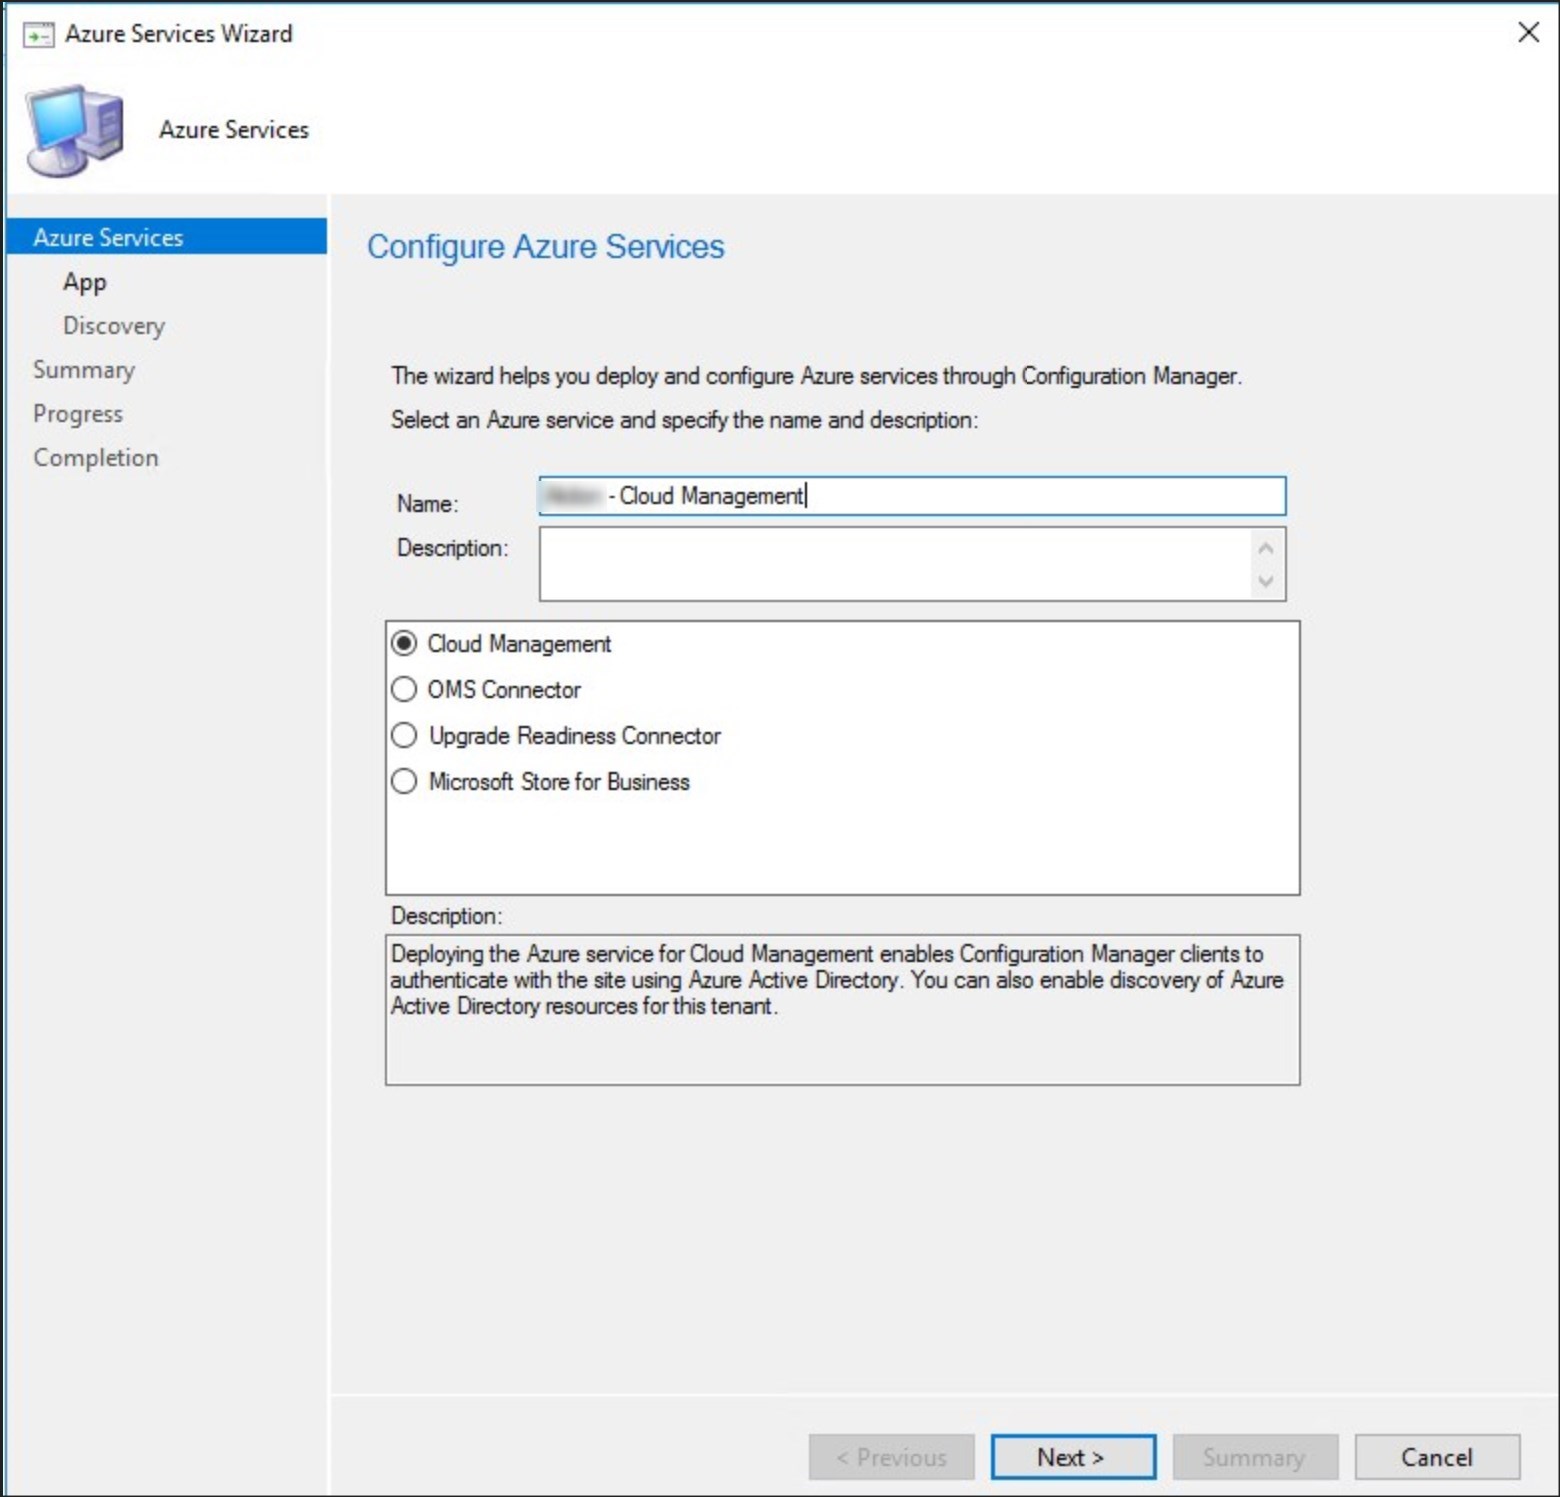
Specify a name and select Cloud Management, click Next
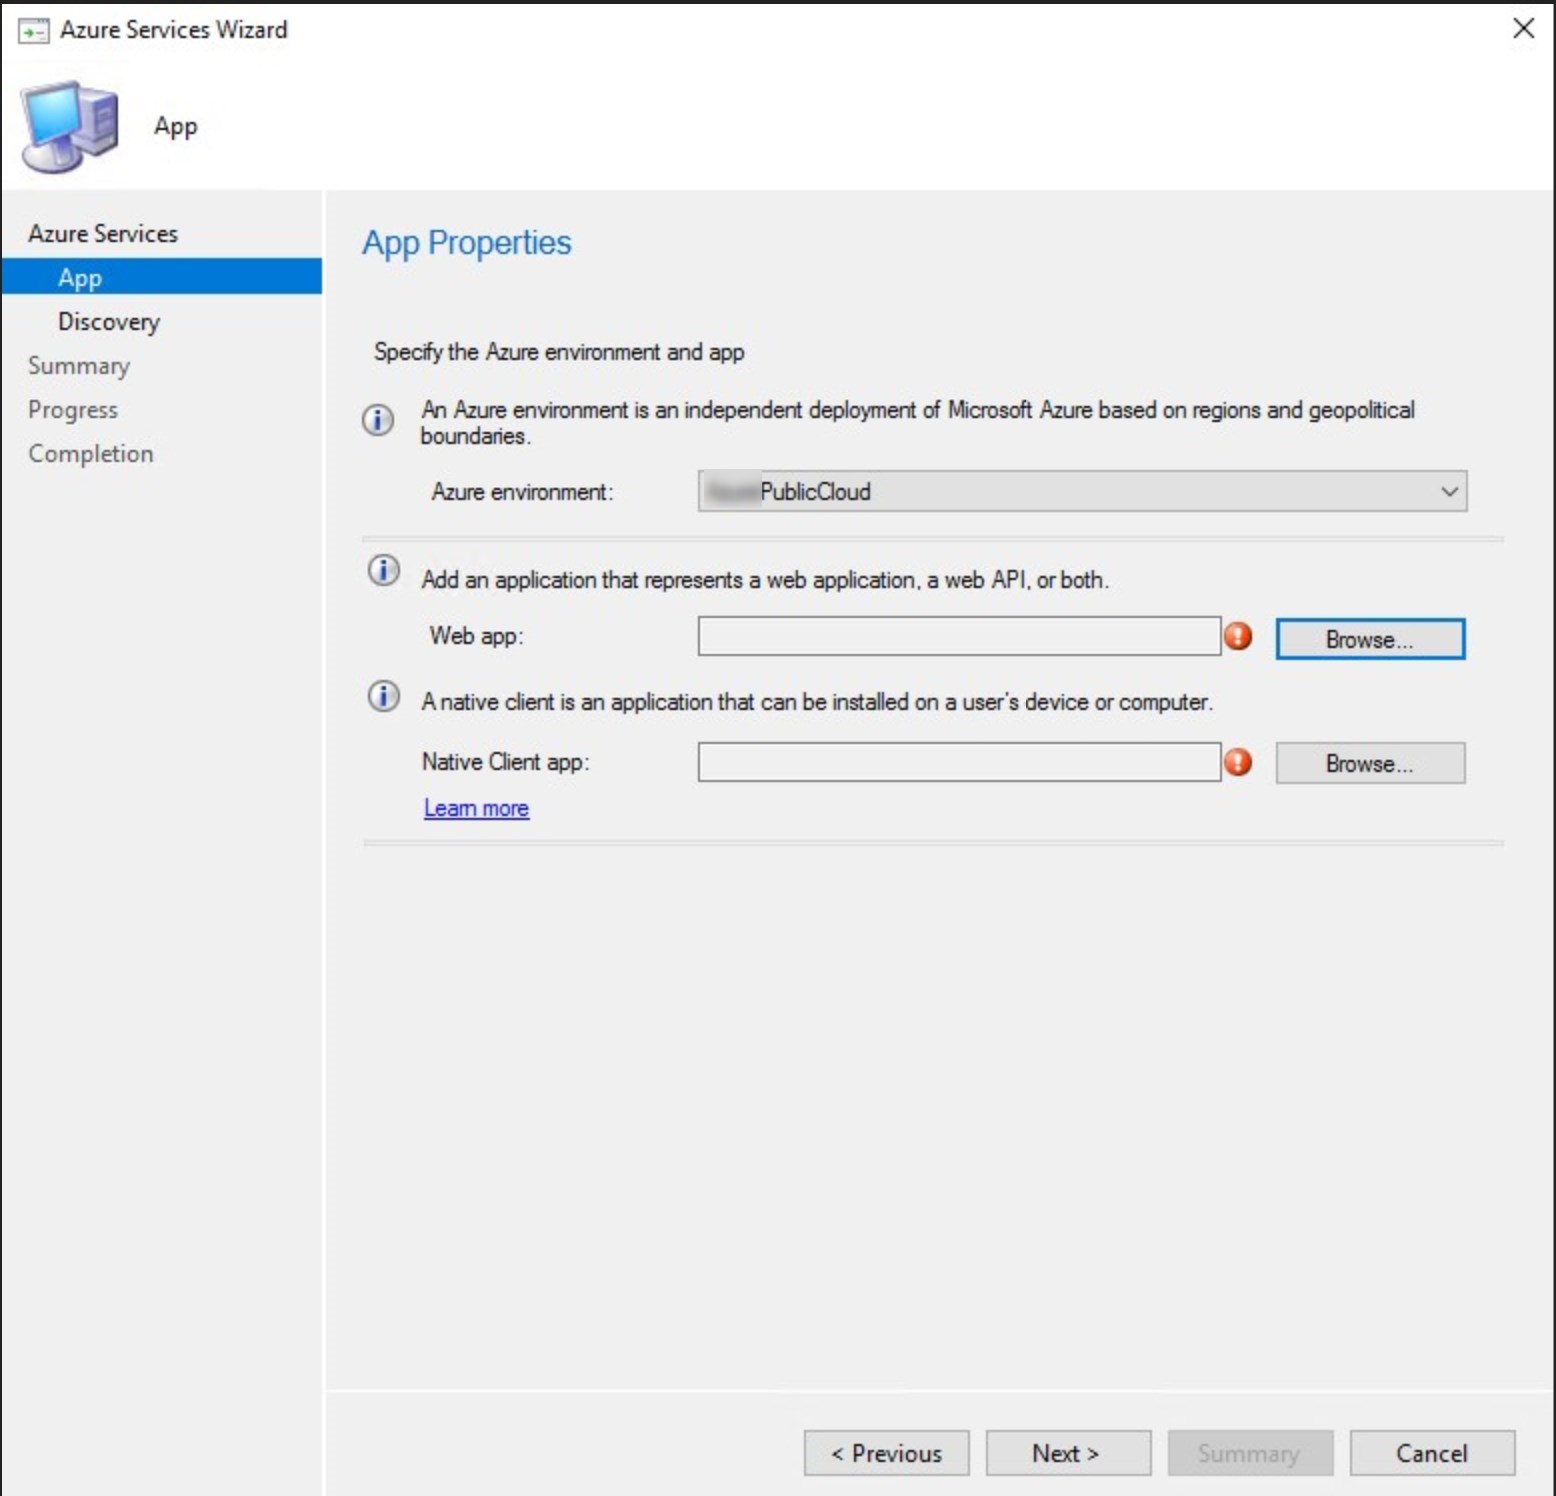
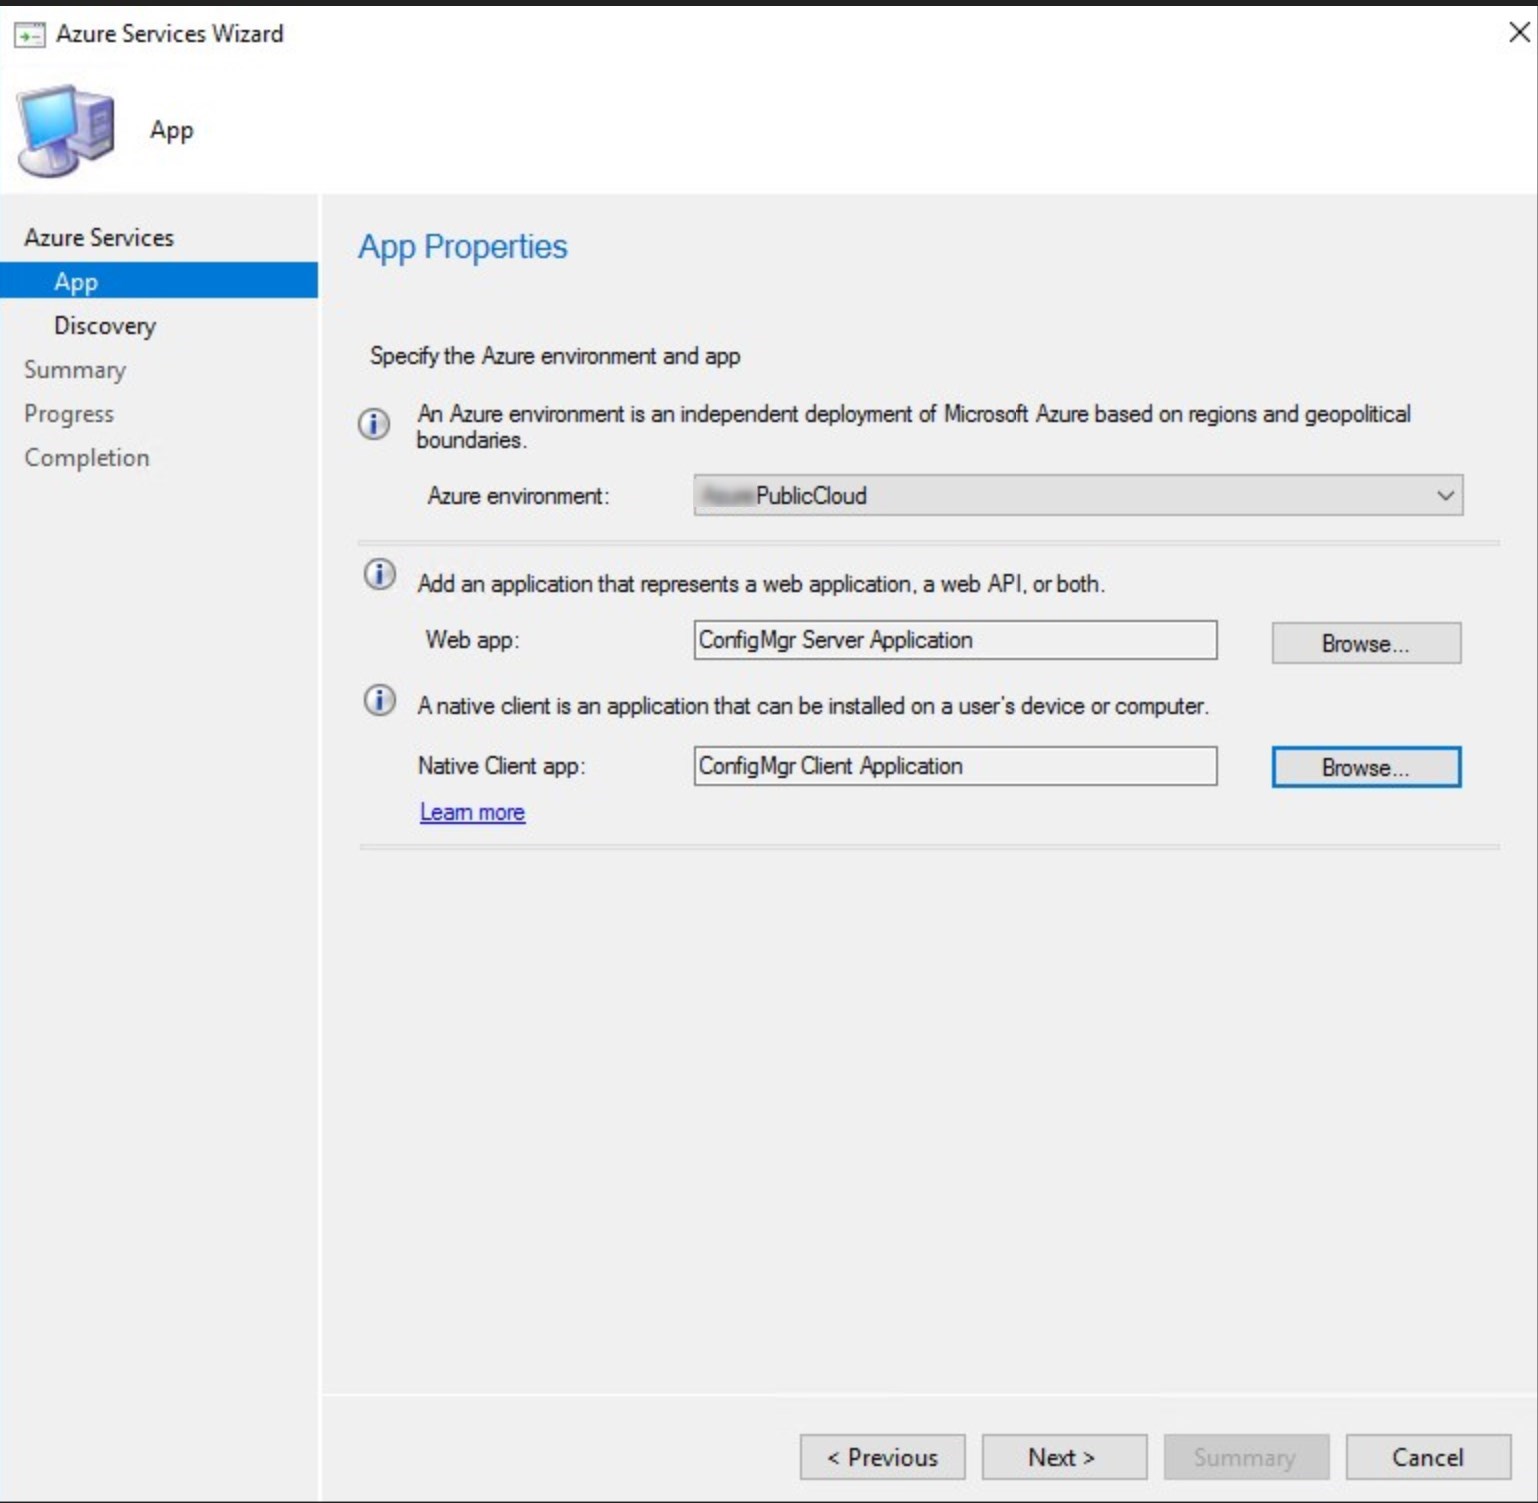
In this step, the Azure Administrator will be required to create the web app and native client app. Click on Browse for the Web app
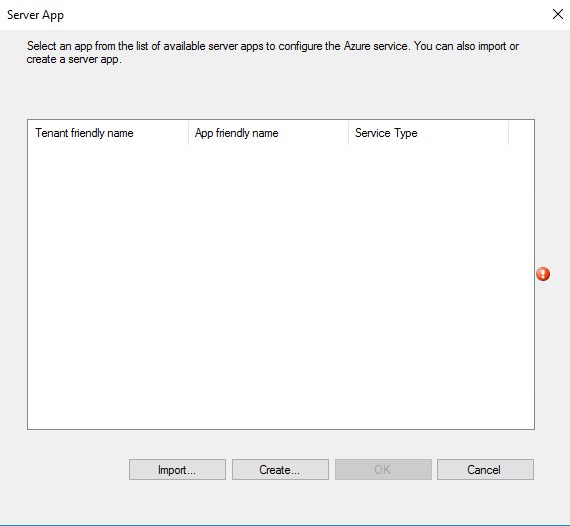
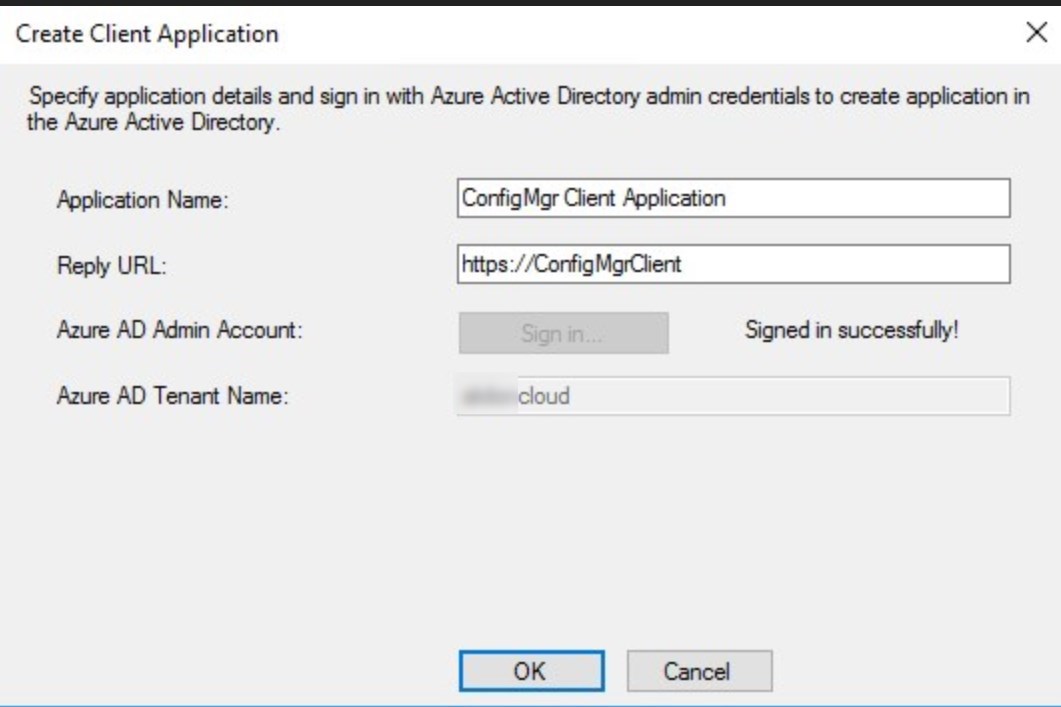
Click on Create
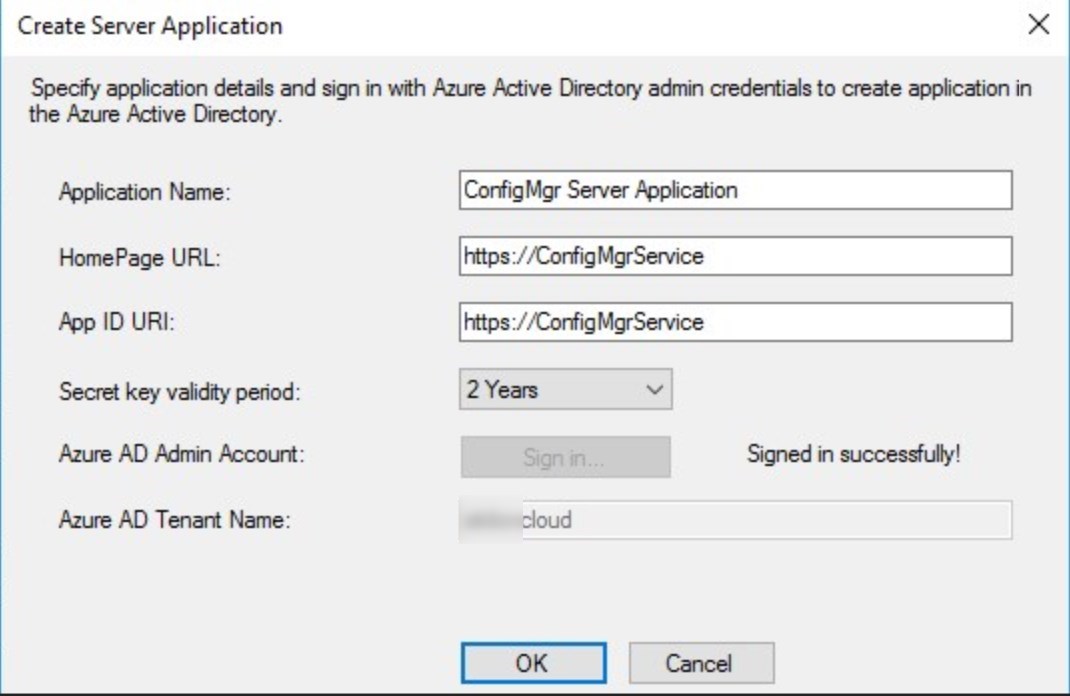
Click the Sign in and provide Azure administrator credentials. Default names do just fine. Click OK when login completed
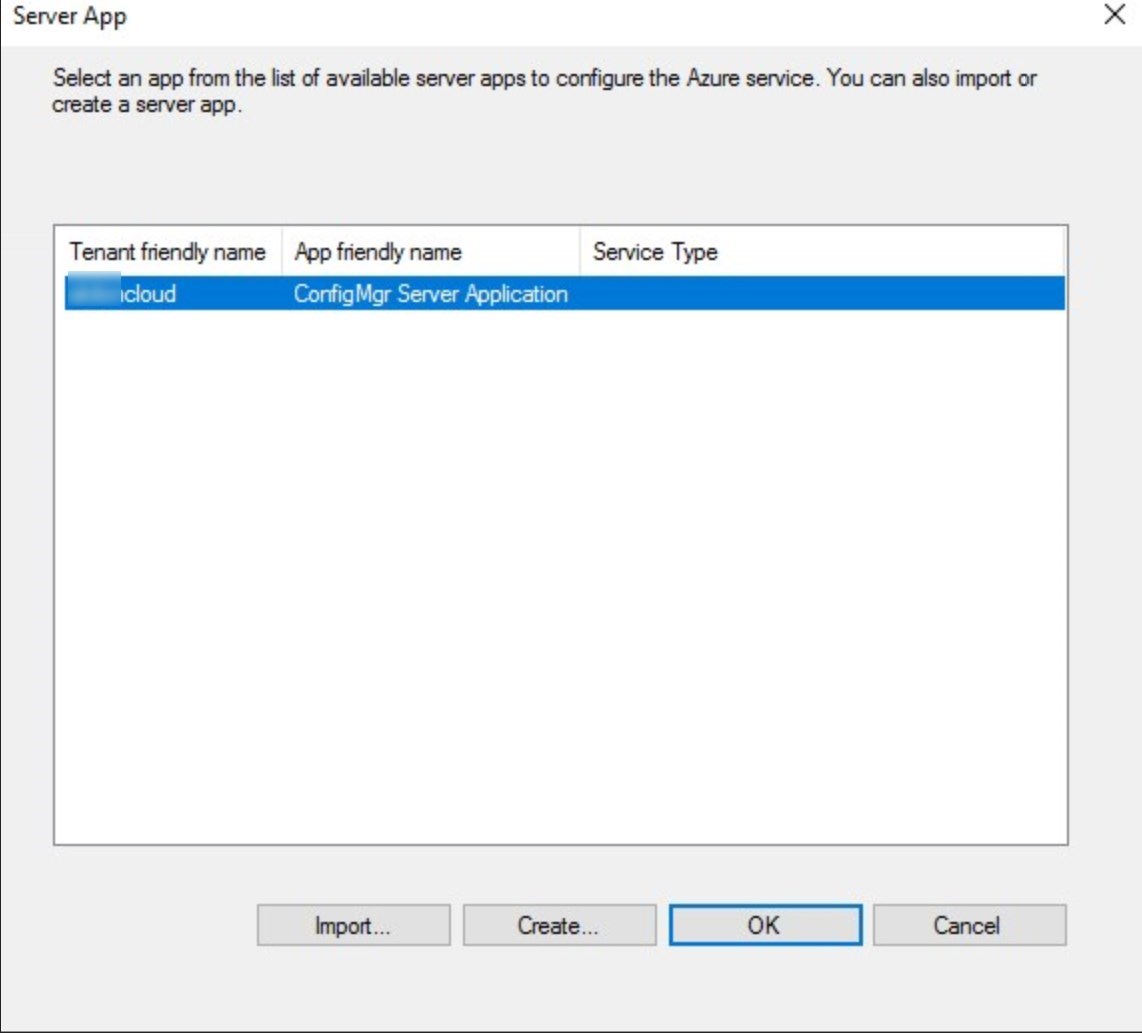
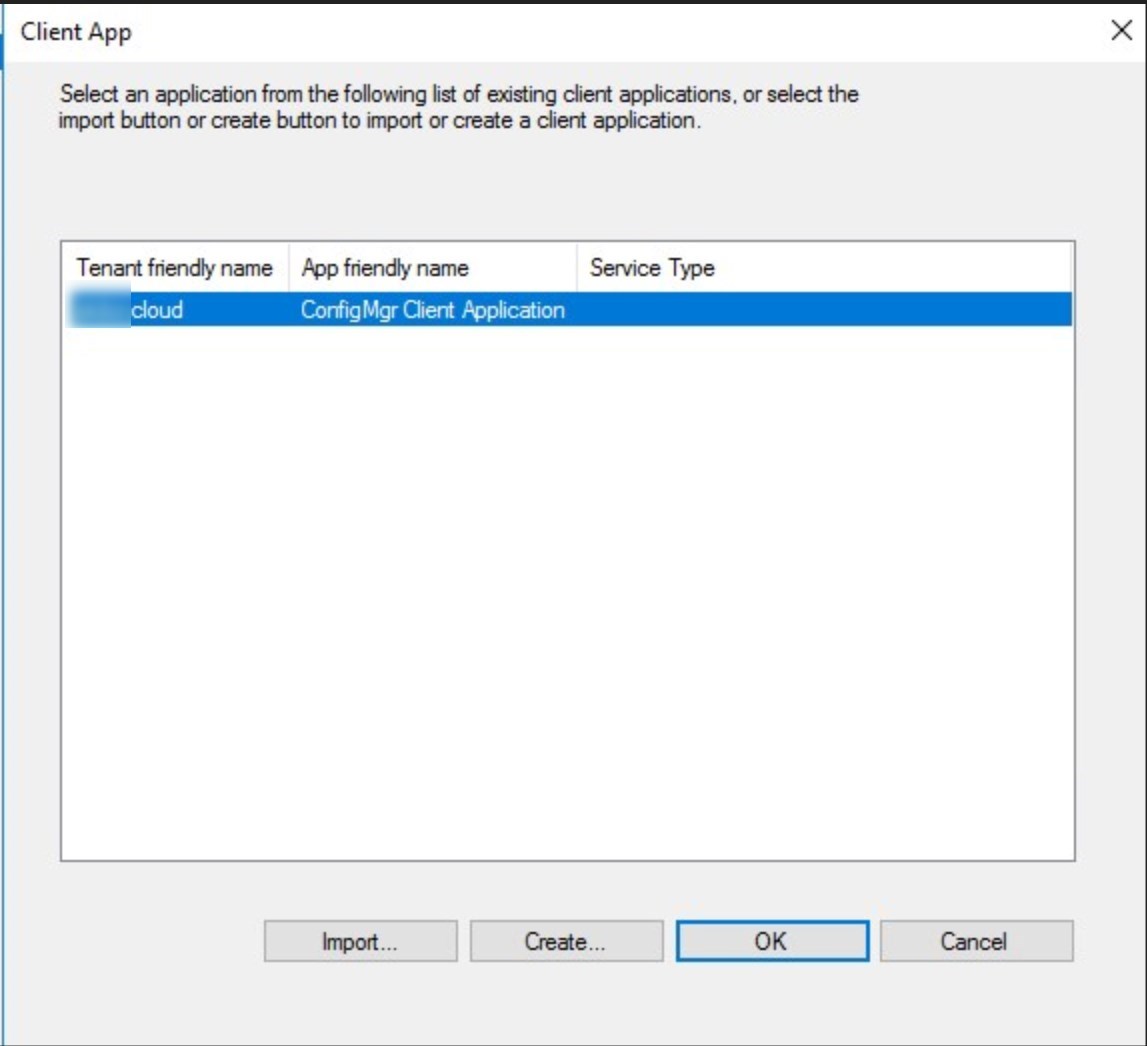
Select the App that was just created and click OK
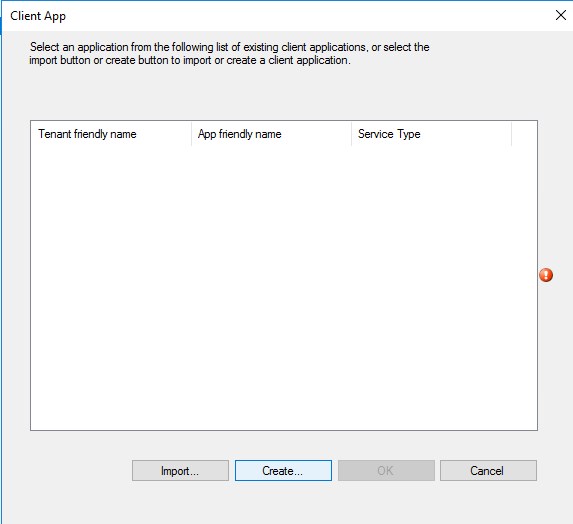
Click Browse for the Native client app. Click Create
Click the Sign in and provide Azure administrator credentials. Default names do just fine. Click OK when login completed
Select the App that was just created and click OK
Click Next
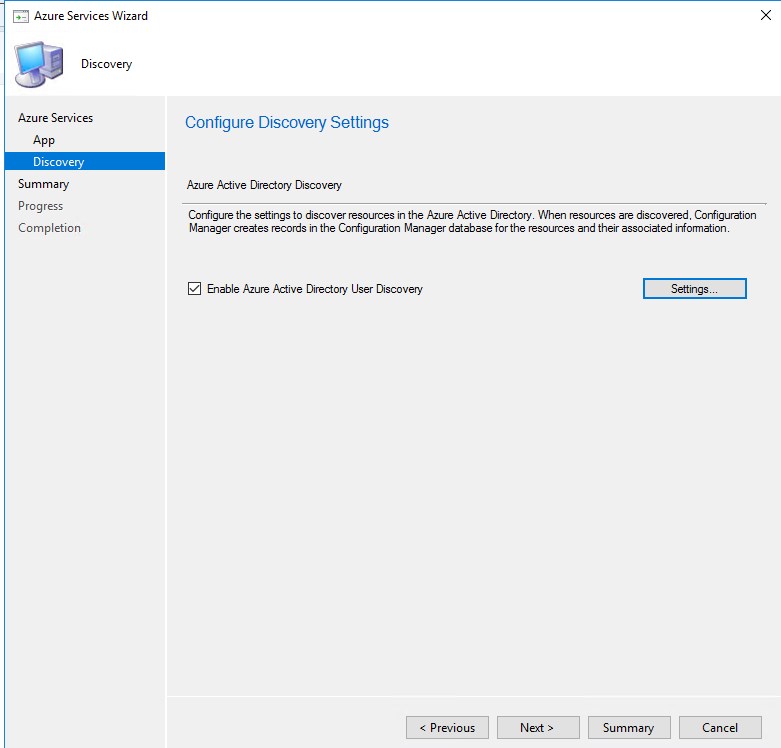
Chose to Enable Azure Active Directory User Discovery or not.
Note
The Azure AD Discovery is not a requirement for Cloud Management gateway to work
Click Next
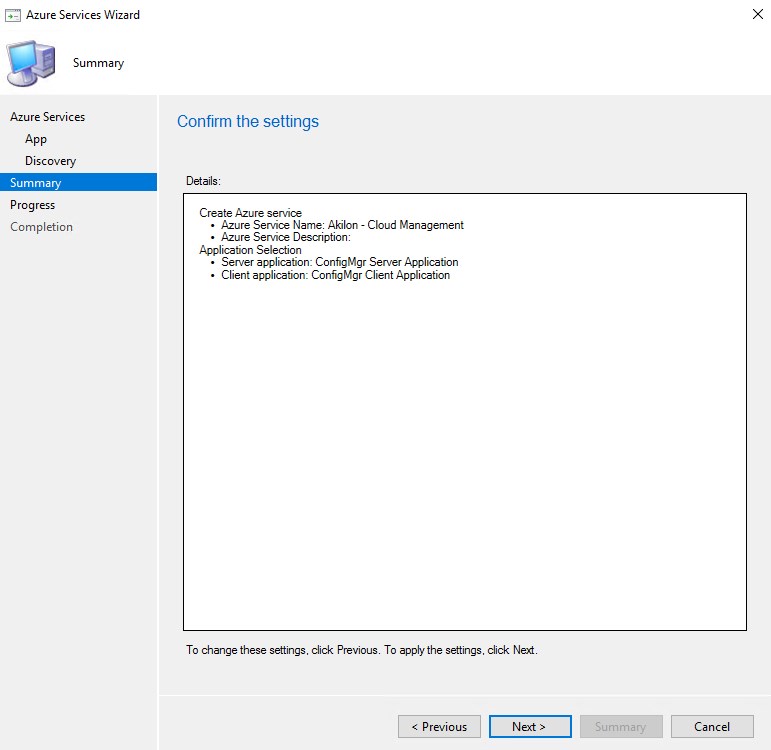
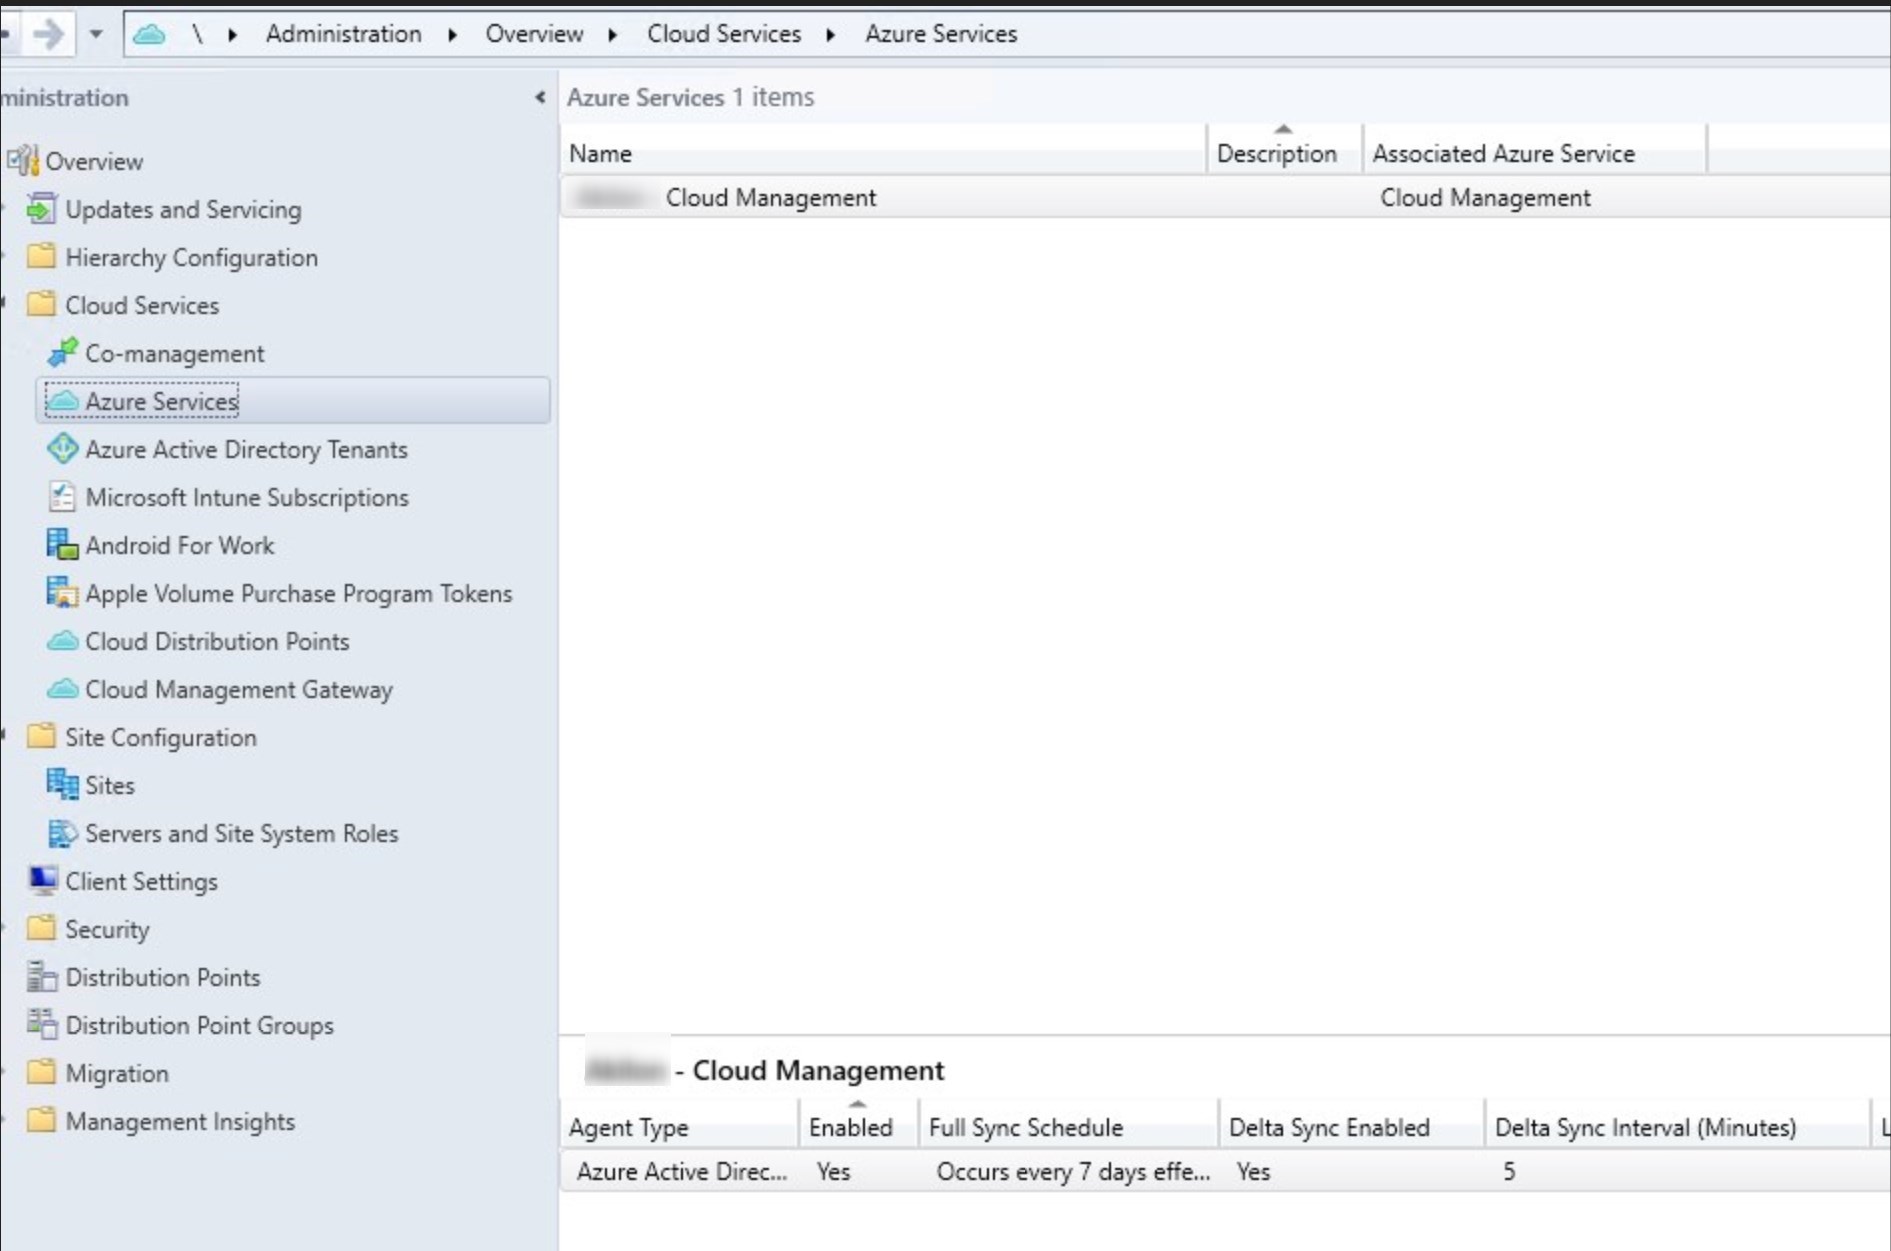
The Azure service is completed. If enabled, the AAD user discovery can be modified
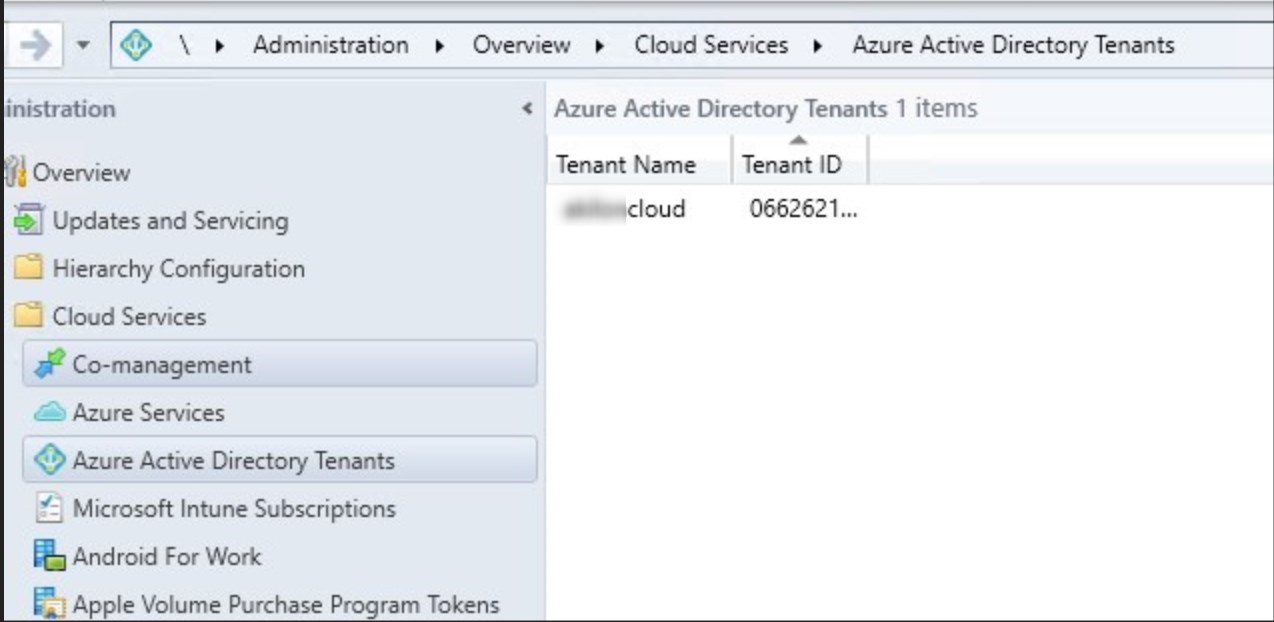
the Azure AD Tenant is now configured
Cloud Management Gateway server authentication Certificate requirements
The certificate requirements are the most complex part of configuring the Cloud Management Gateway.
A certificate is needed between the SCCM server and the Cloud Management Gateway.
The following choices are available :
Use a certificate from a public trusted provider
This option requires a CNAME to be created in the DNS for CMGSCD.SystemCenterDudes.com to the real hostname CMGSCD.CloudApp.Net
Use a certificate from an enterprise CA
This certificate must be trusted by all computers that will connect with the Cloud Management Gateway
Use format <CMG name>.CloudApp.Net
The CMG server authentication certificate supports wildcards. Some certificate authorities issue certificates using a wildcard character for the service name prefix. For example, *.scd.com
For this post, we will use a certificate from an Enterprise CA.
Create and Issue a Custom Web Server Certificate Template on your Certification Authority
This procedure creates a custom certificate template that is based on the web server certificate template. The certificate will be used for the installation of the SCCM cloud management gateway and the private key must be exportable as it will be asked during installation.
In Active Directory, create a security group named SCCM Site Servers that contain your SCCM Primary Site server computer account
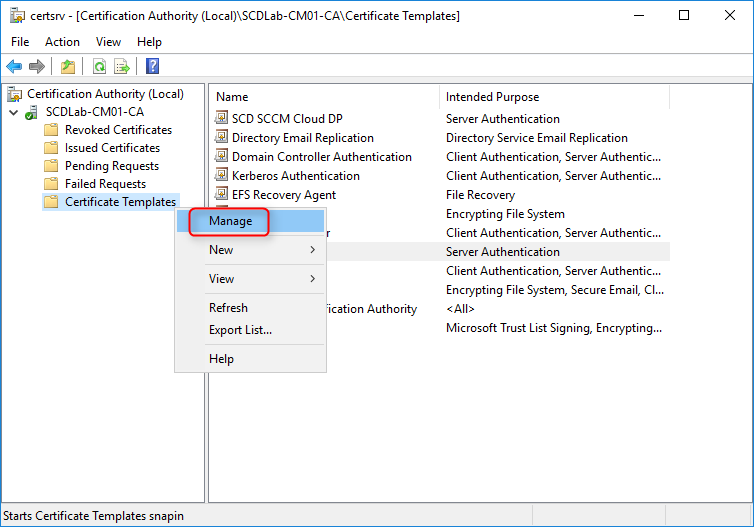
On the server running the Certification Authority, open the Certification Authority console (certsrv.mmc), right-click Certificate Templates and select Manage
The Certificate Templates management console opens
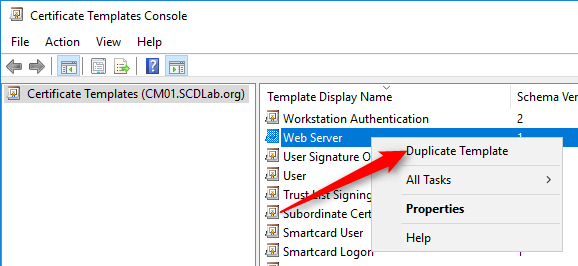
Right-click the Web Server template and then select Duplicate Template
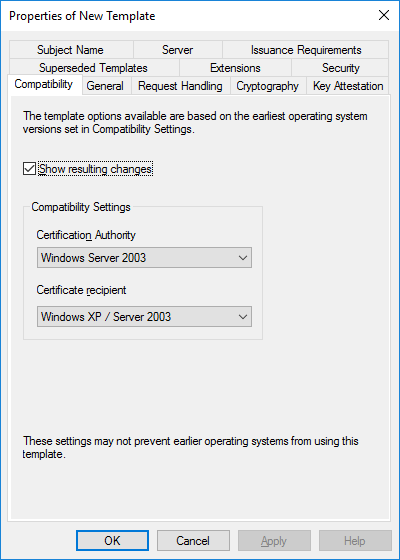
In the Duplicate Template dialog box, ensure that Windows 2003 Server, Enterprise Edition is selected in Certification Authority
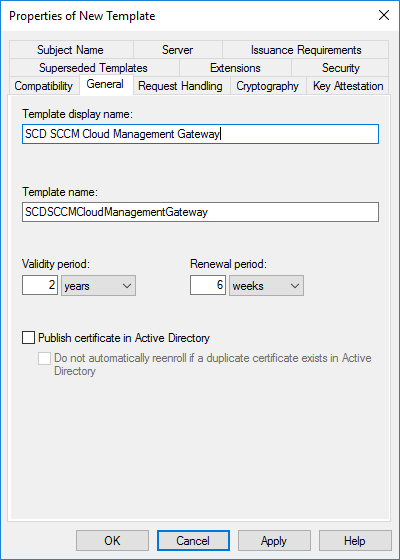
In the General tab, enter a template name, like SCD SCCM Cloud Management Gateway. Change the validity period if needed. As a best-practice, the longer the validity period, the less secure is your certificate
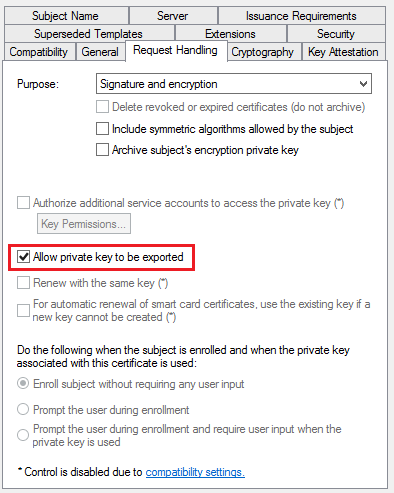
In the Request Handling tab, select Allow private key to be exported
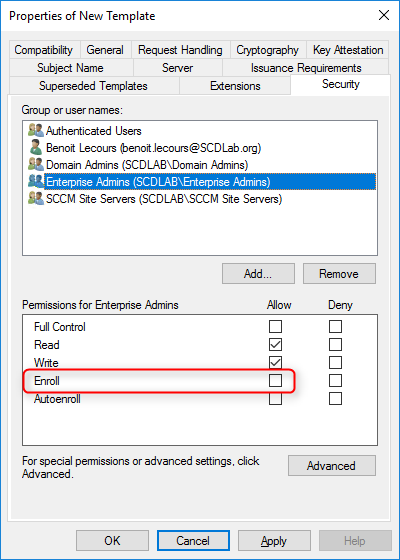
In the Security tab, remove the Enroll permission from the Enterprise Admins security group
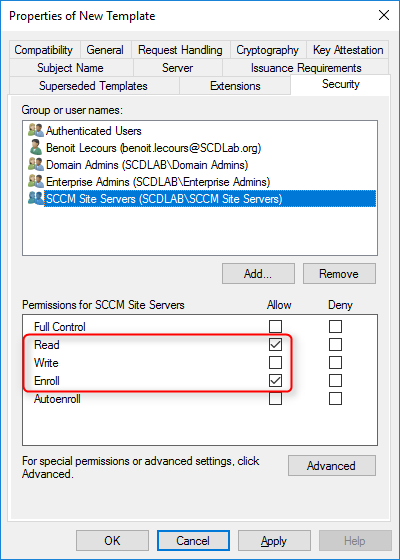
Choose Add, enter SCCM Site Servers in the text box, and then choose OK
Select the Enroll and Read permission for this group
Choose OK, close Certificate Templates Console
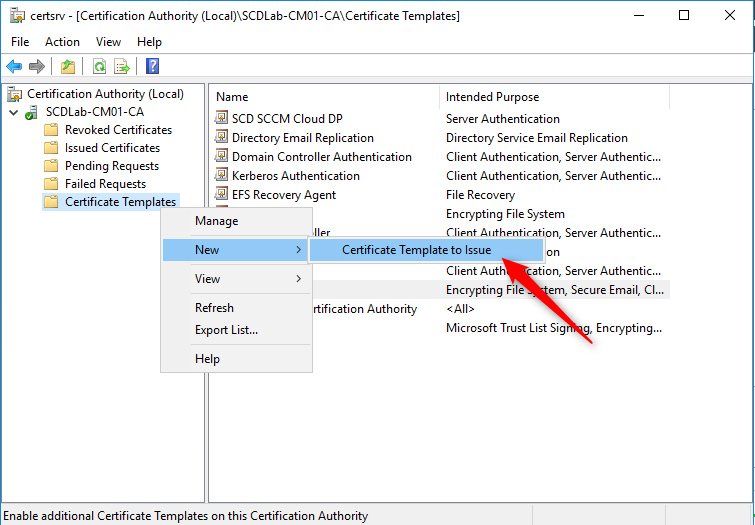
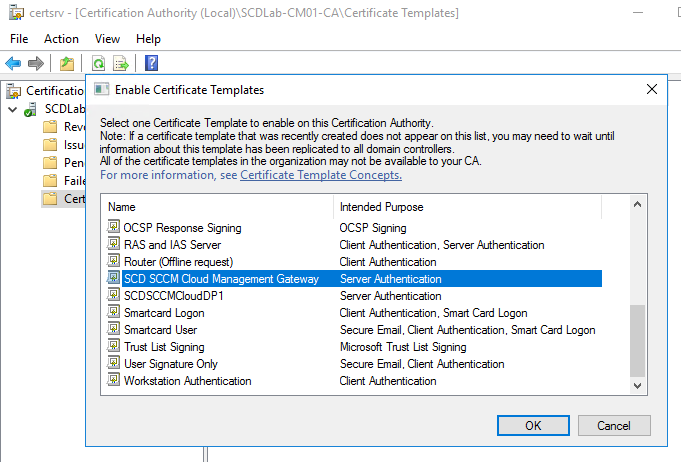
Back in the Certification Authority (certsrv.mmc) console, right-click Certificate Templates, select New / Certificate Template to Issue
In the Enable Certificate Templates dialog box, select the new template that you just created, SCD SCCM Cloud Management Gateway, click OK
Request the custom web server certificate on the Primary Site Server
This procedure requests and then installs the newly created custom web server certificate on the Primary Site prior to the SCCM cloud management gateway installation
On the SCCM Server, run MMC
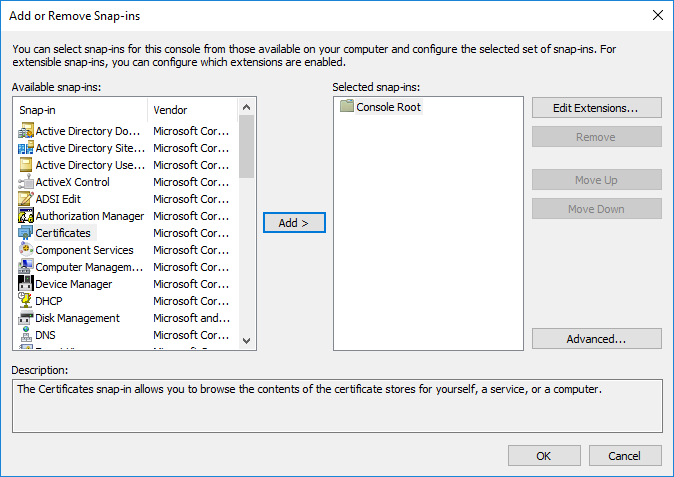
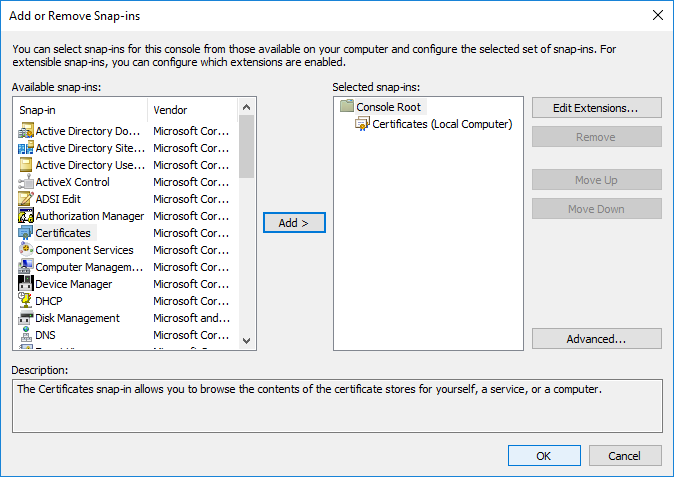
On the File Menu, choose Add/Remove Snap-in… select Certificates, and click Add
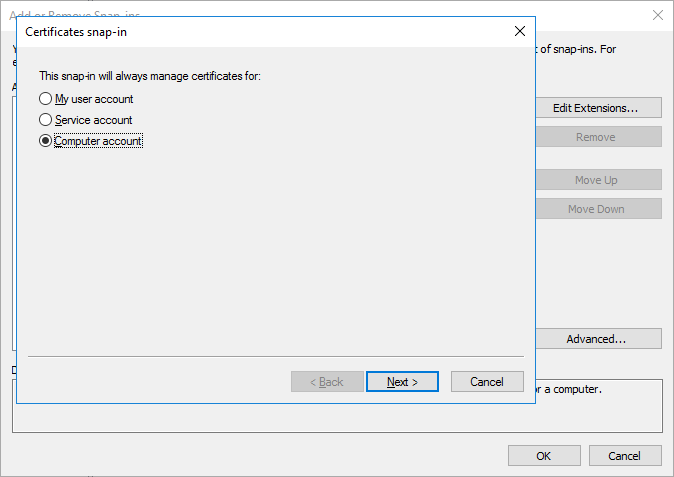
When prompted for what you want to manage certificates for, select Computer Account, click Next
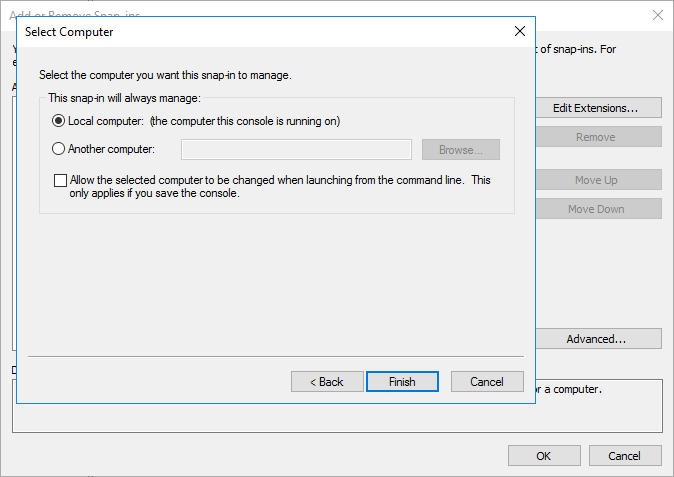
Select Local Computer and then click Finish
Click OK to close the Add/Remove Snap-ins
In the Add or Remove Snap-ins dialog box, choose OK.
In the console, expand Certificates (Local Computer) /Personal / Certificates
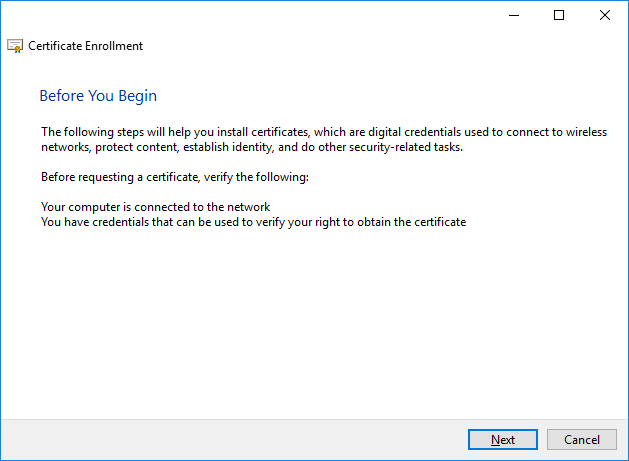
Right-click Certificates, select All Tasks /Request New Certificate
On the Before You Begin page, click Next
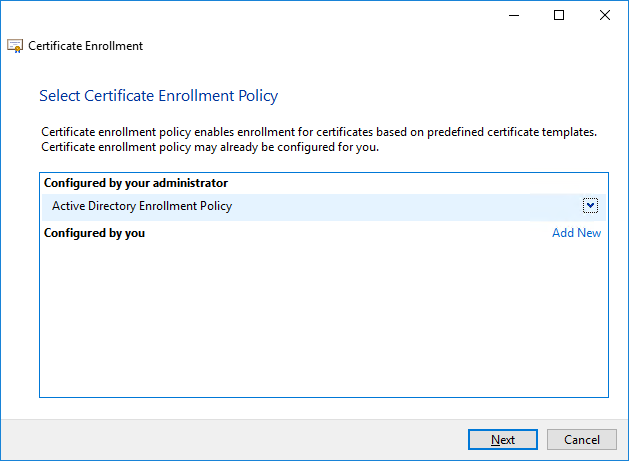
If you see the Select Certificate Enrollment Policy page, choose Next
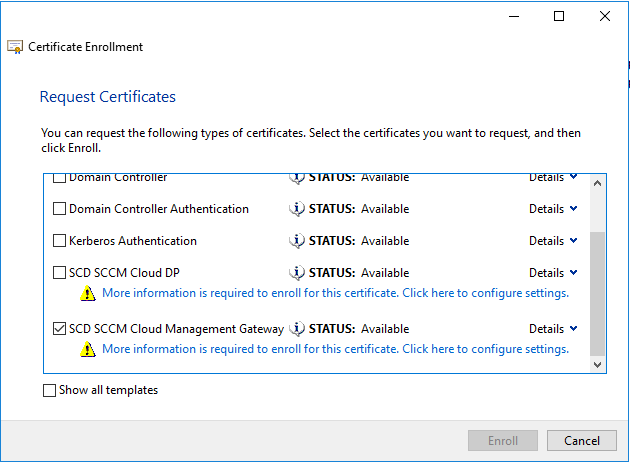
On the Request Certificates page, identify the SCD SCCM Cloud Management Gateway from the list of available certificates, and then select More information is required to enroll for this certificate. choose here to configure settings
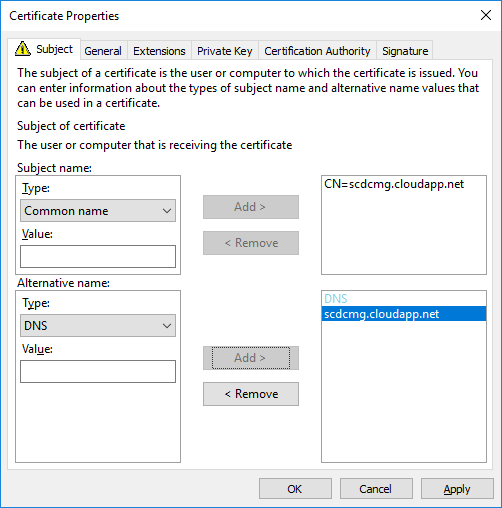
In the Certificate Properties dialog box, in the Subject tab
Subject name: in Type choose Common name
Value: Specify your service name and your domain name by using an FQDN format. (For example: scdcmg.cloudapp.net) and select Add
Alternative name: in Type choose DNS
Value: Specify your service name and your domain name by using an FQDN format. (For example: scdcmg.cloudapp.net) and select Add
Important Info
In all cases this certificate will determine the name of the Cloud Management Gateway.
Only letters and numbers are allowed in the name.
A valid example is CMGSCD.cloudapp.net
An invalid example is CMG-SCD.cloudApp.Net
Click OK to close the Certificate Properties dialog box
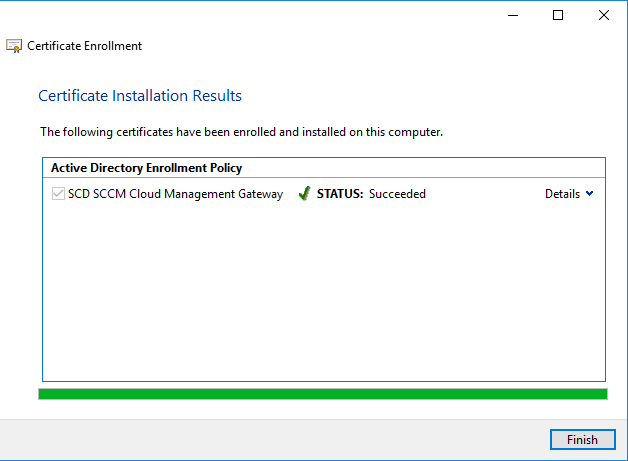
On the Request Certificates page, select SCD SCCM Cloud Management Gateway from the list of available certificates, click Enroll
On the Certificates Installation Results page, wait until the certificate is installed, click Finish
Export Web Server Certificate
This procedure exports the custom web server certificate to file. We will export it as a .CER file for the Azure Management Certificate and in a .PFX format for the cloud management gateway creation.
.CER EXPORT
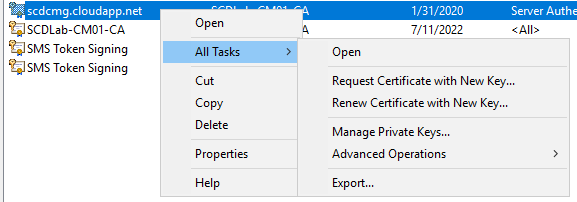
In the Certificates (Local Computer) console, right-click the SCD Cloud Management Gateway certificate that you just created, select All Tasks / Export
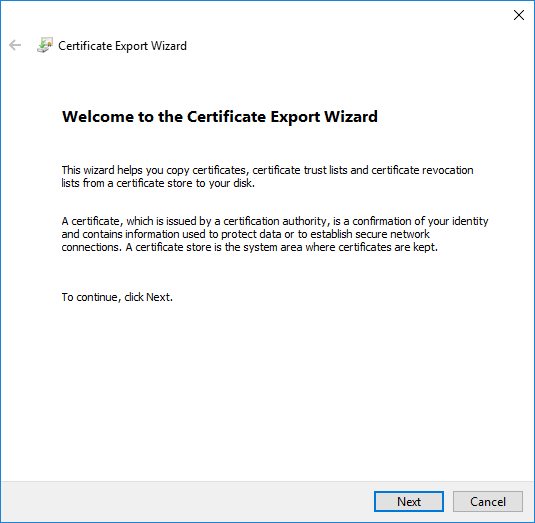
In the Certificates Export Wizard, choose Next
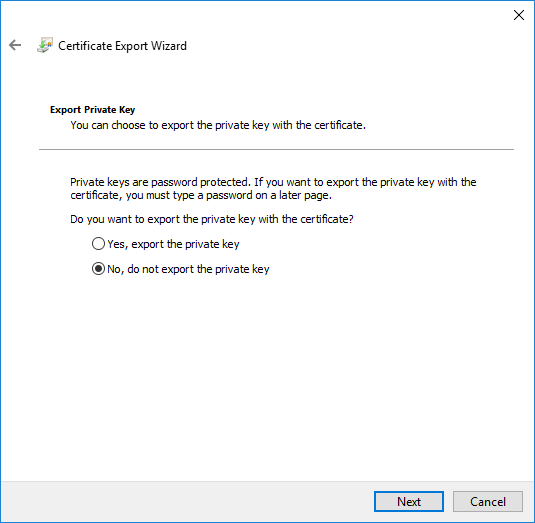
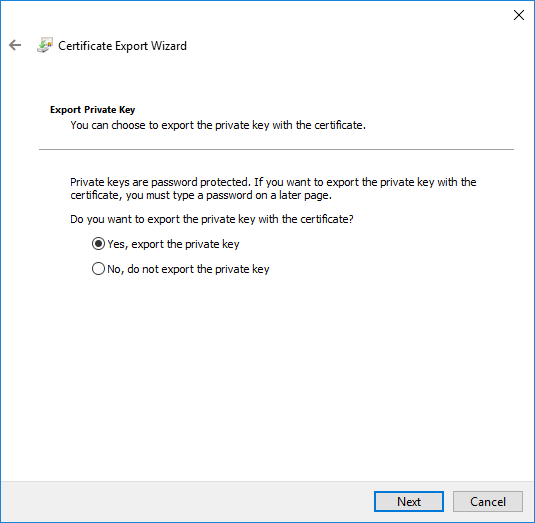
On the Export Private Key page, select No do not export the private key and click Next
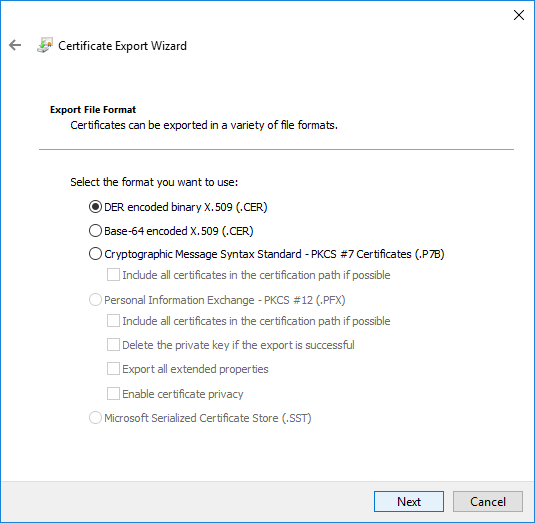
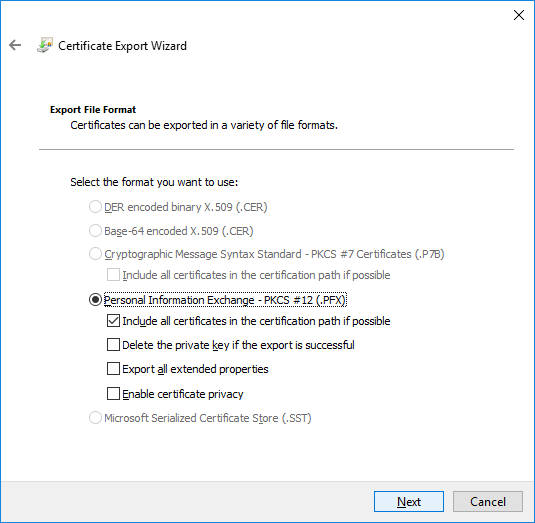
On the Export file format, select CER and click Next
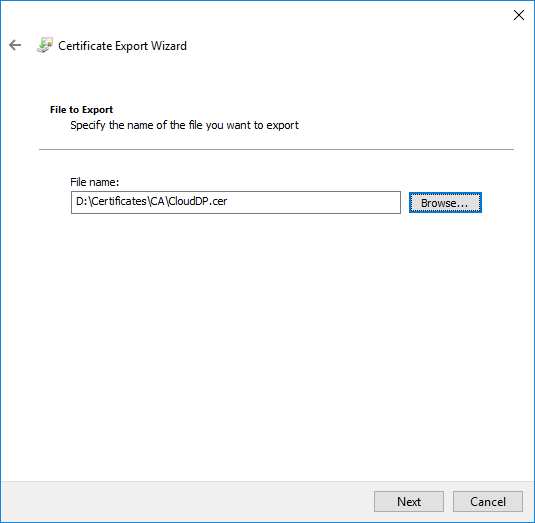
Save your certificate in a folder and close the wizard
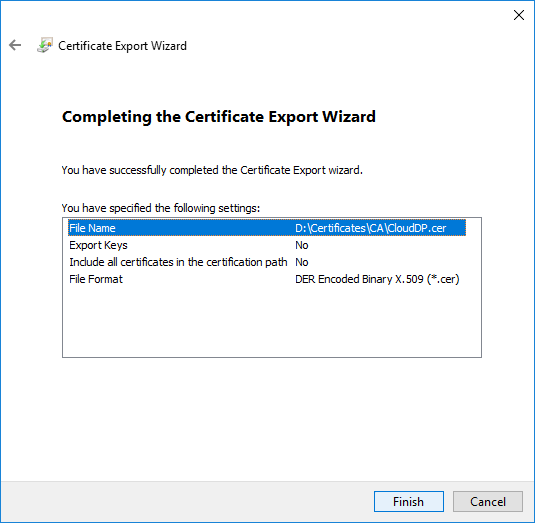
To close the wizard, click Finish in the Certificate Export Wizard page
.PFX EXPORT
Redo the export task a second time
On the Export Private Key page, choose Yes, export the private key, click Next
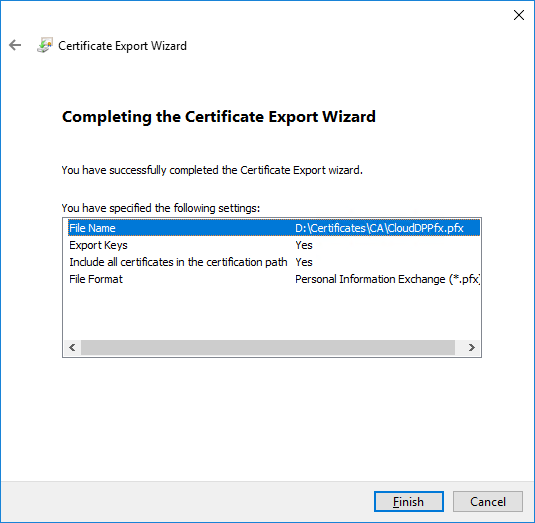
On the Export File Format page, ensure that the Personal Information Exchange – PKCS #12 (.PFX) option is selected
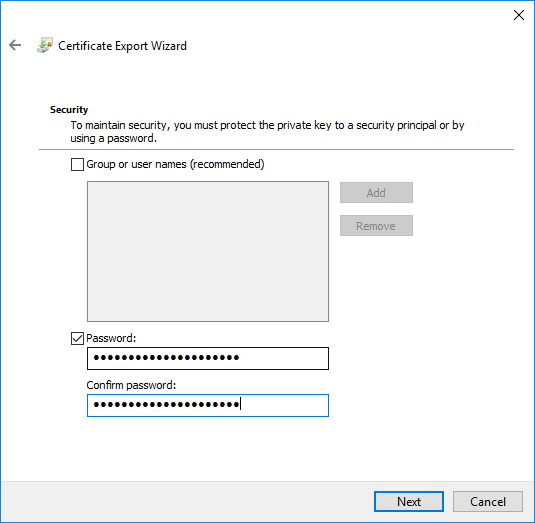
On the Password page, specify a strong password to protect the exported certificate with its private key, and then click Next
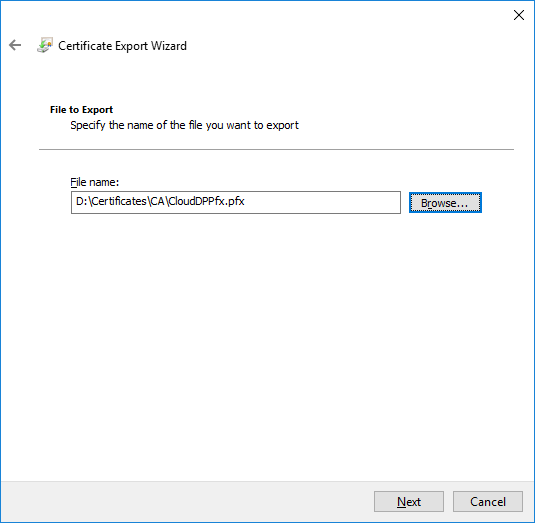
On the File to Export page, specify the name of the file that you want to export
To close the wizard, click Finish in the Certificate Export Wizard page
Close Certificates (Local Computer).
The certificate is now ready to be imported to create an SCCM Cloud Management Point Gateway.
Client Authentication
SCCM clients can authenticate on the Cloud Management gateway following one of these methods:
Devices are Azure AD joined (Hybrid AD Joined)
Azure AD registered device is not enough for authentication
This isn’t covered in this guide, but here’s more information from Microsoft Docs
Token-based authentication
This feature is only available from SCCM 2002 release and above
Client certificate using an Enterprise CA
Token-based authentication
This feature is only available from SCCM 2002 or higher. If you do not have an Enterprise CA and computers are not joined yet to Azure AD, this is a good alternative.
The token-based does not require any kind of configuration or enablement once SCCM is up to date with 2002 or higher. The most important part is that the update on the client-side is mandatory to use the Token-based authentication.
The way it is working is simple. The Management Point issue a token to the client to be authenticated on the Cloud Management gateway while connected on-prem. This token is then automatically renewed each month and is valid for up to 90 days.
Important Info
Microsoft still recommends using Azure AD joined to authenticate on the Cloud Management Gateway.
It is also possible to generate a bulk registration token to allow external devices for a first communication with the Cloud Management Gateway. This could be useful for devices in a DMZ for example.
For more details about Token-based authentication, see Microsoft docs
Client authentication certificate requirements
This method relies on an Enterprise CA to manage the client certificate.
If computers are Azure AD joined, or you have chosen to leverage the new Token-based authentication, this step can be skipped.
If you need to create a Client authentication certificate on your Enterprise CA, here’s the steps:
RDP to an Intermediate Certification Authority
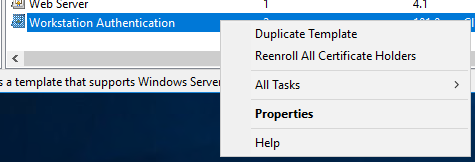
Open Certification Authority console, right-click Certificate Templates and click Manage
Right-click Workstation Authentication and click Duplicate Template
Make sure to use Server 2003, not 2008
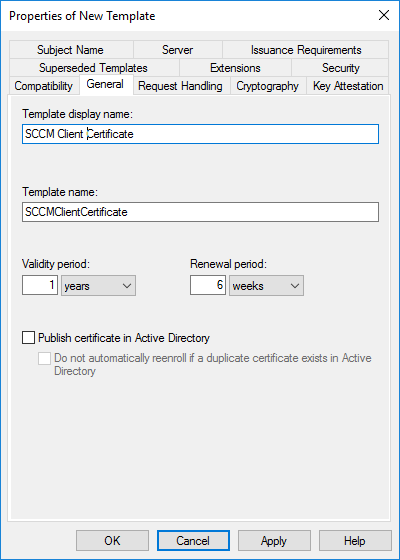
In the General, name this SCCM Client Certificate
Set the Validity Period to 5 years
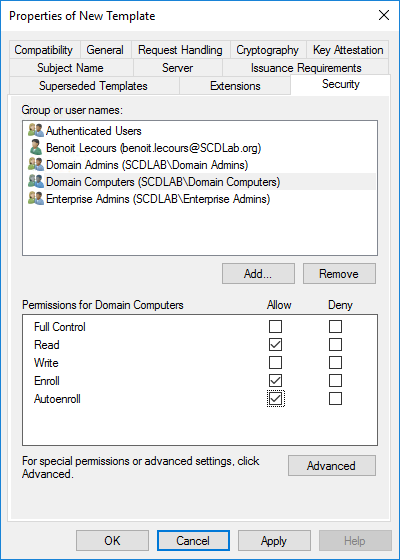
Click on the Security tab, select the Domain Computers group and add the permissions of Read and Autoenroll, do not clear Enroll. Then click OK
When you refresh your console, you will see that the new template is there
Create an Auto-Enroll Group Policy
A client certificate is required on any computer which will be managed via the Cloud Management Gateway. It is also required on the server that will host the Cloud Management Gateway connection point.
The fastest way to deploy the client certificate to all your machines is through an autoenrollment GPO :
Launch Group Policy Management on your Domain (Start / Administrative Tools /Group Policy Management)
Right-click the desired OU and select Create a GPO in this domain, and Link it here… as we are going to create a new GPO
Name your GPO AutoEnroll ConfigMgr Client Cert, then click OK
Right-click and Edit your newly created GPO
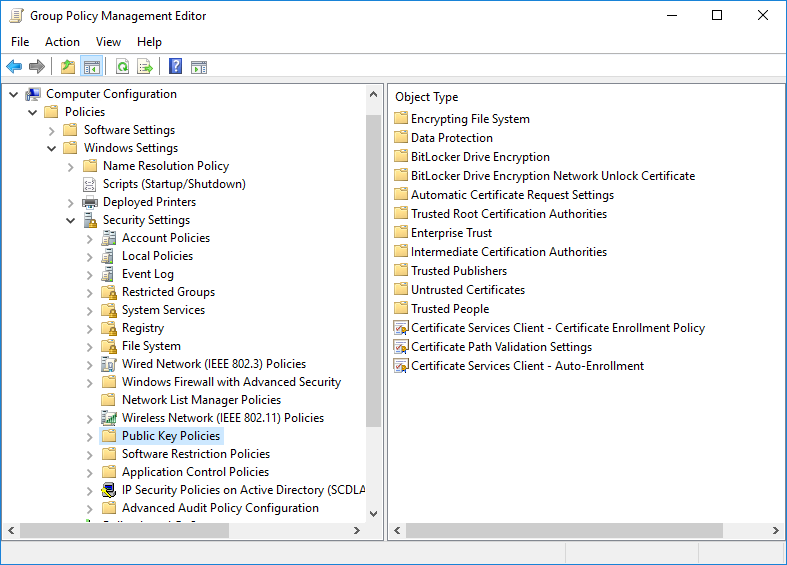
Navigate to: Computer Configuration / Policies / Windows Settings / Security Settings / Public Key Policies
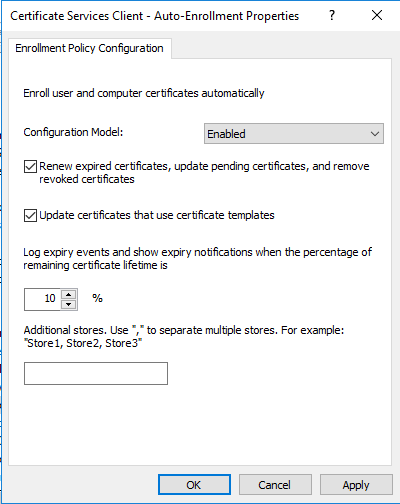
Right-click on Certificate Services Client – Auto-Enrollment and then click Properties
Change the Configuration Model: to Enabled
Check the Update certificates that use certificate templates and Renew expired certificates, update pending certificates, and remove revoked certificates
Click Apply and OK
Reboot a workstation and when you run a gpupdate /force or in 15 minutes when GP is re-applied, any machine on the domain communicating with the DC will request and receive a client certificate automatically that will be placed in theLocal Computer Personal Certificate Store
Export the client certificate’s root
The easiest way to export the root of the client certificates used on the network is to get it on one of the domain-joined machines that receive it through your auto-enrollment GPO
Requirements
Client certificates are required on any computer you want to manage with cloud management gateway and on the site system server hosting the cloud management gateway connector point
Run MMC
From the File menu, choose Add/Remove Snap-in…
In the Add or Remove Snap-ins dialog box, choose Certificates / Add /Computer account / Local computer
Go to Certificates / Personal / Certificates
Double-click the certificate for client authentication on the computer, choose the Certification Path tab, and double-click the root authority (at the top of the path).
On the Details tab, choose Copy to File…
Complete the Certificate Export Wizard using the default certificate format. You’ll need it to configure the cloud management gateway (CMG) later
Configure SCCM Cloud Management Gateway
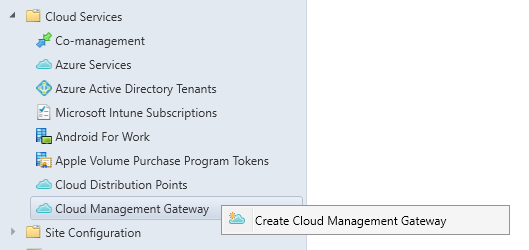
Go to Administration/Cloud Services/Cloud Management Gateway, select Create cloud management gateway
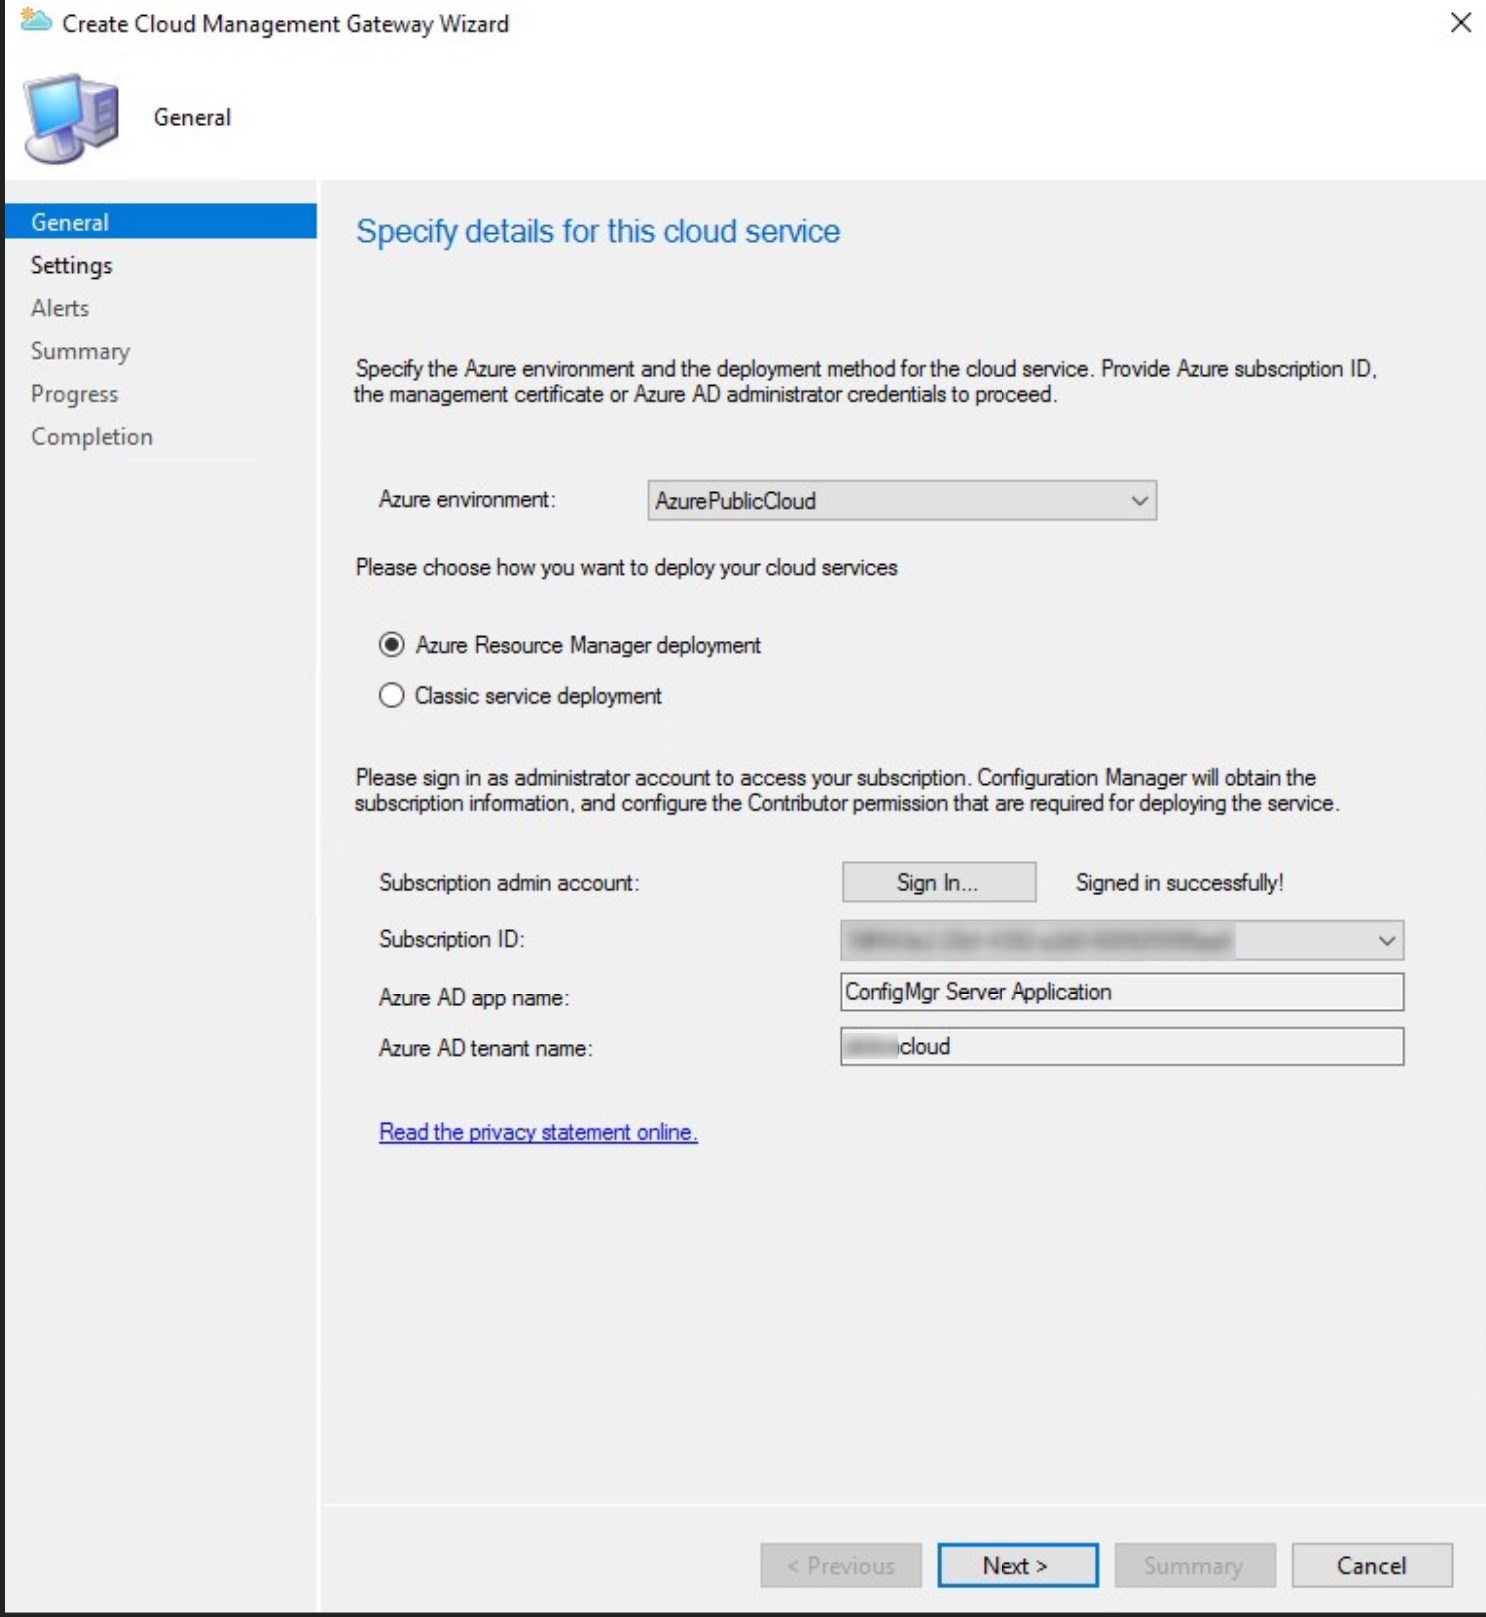
Sign-in with Azure Administrator rights. The Azure AD App name should be auto-populated, click Next
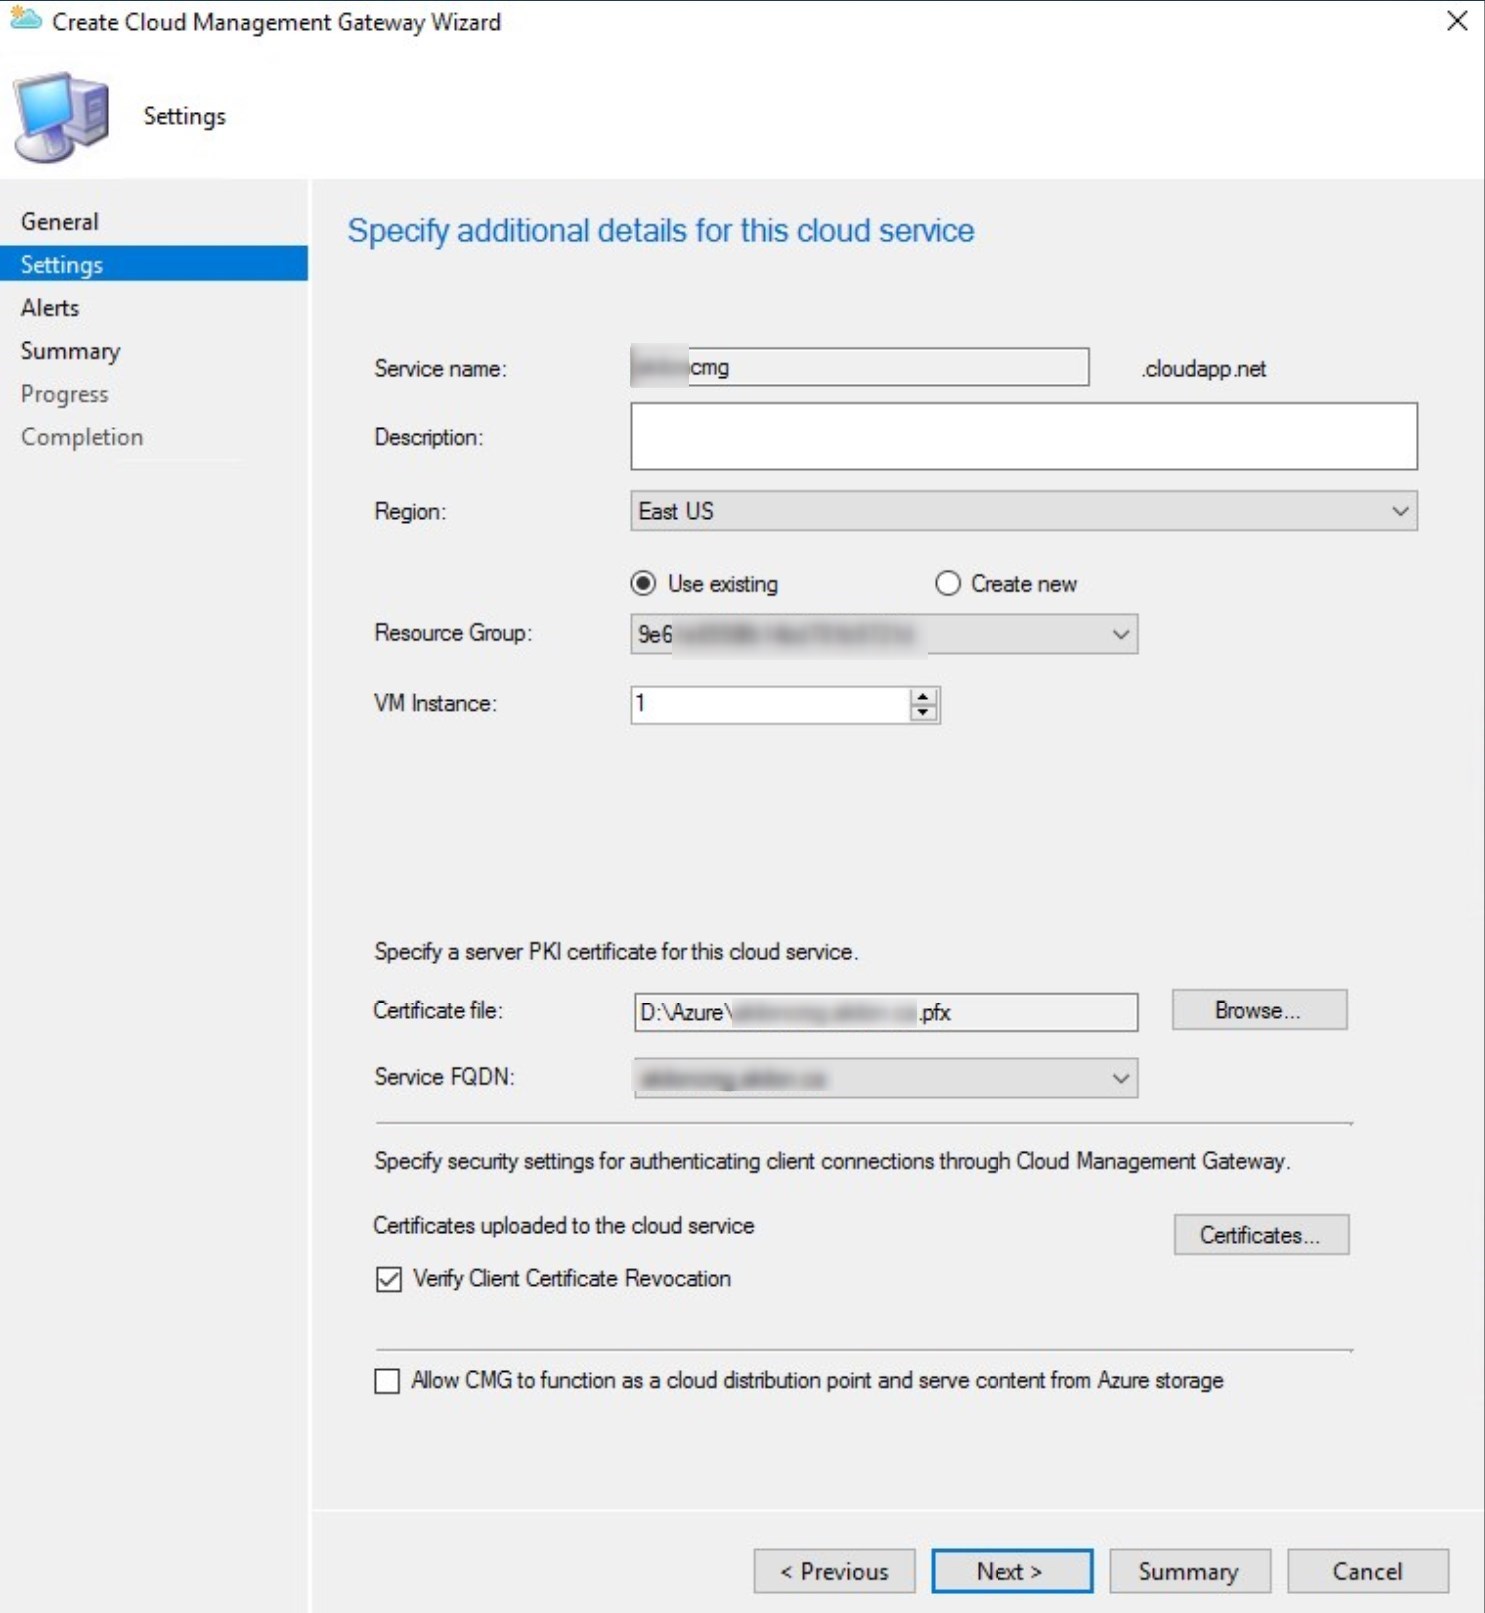
Select :
Service name: provided automatically if the certificate is using .cloudapp.net. If using a public certificate or an internal certificate, the name will need to be entered manually.
Remember, only letter and number for the name.
Region: should be the same as the on-prem Management point
Resource group: select an existing or create a new one
VM instance: 1
Cloud service certificate: select the CMG server authentication certificate or the Public certificate
Client authentication certificate: Provide the client authentication certificate when using an Enterprise CA
Choose to Verify client certificate revocation or not
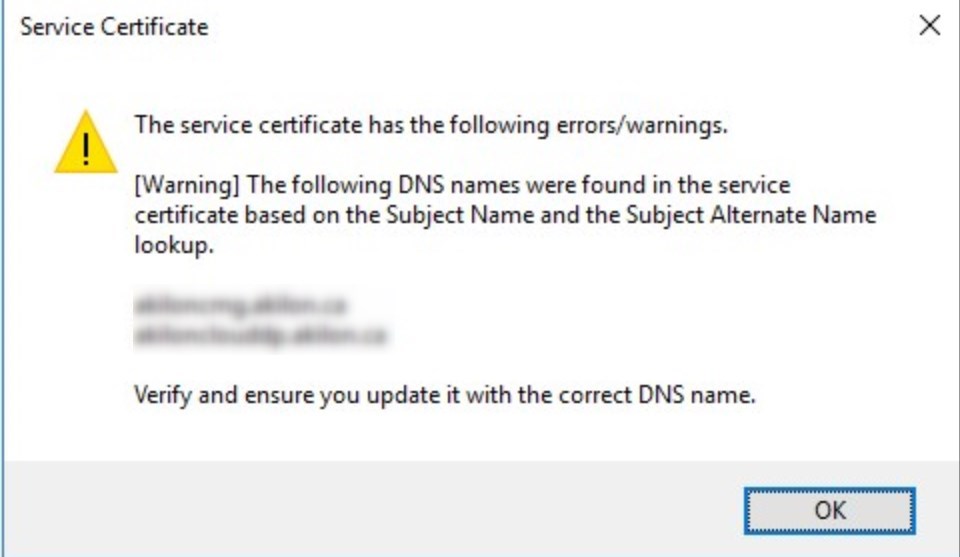
Depending on the certificate used, the following message will display. This will happen when the certificate is not pointing to .cloudapp.net.
This is a reminder about the CNAME requirements.
If you use a wildcard certificate, replace the asterisk (*) in the Service name field with the globally unique deployment name prefix for your CMG.
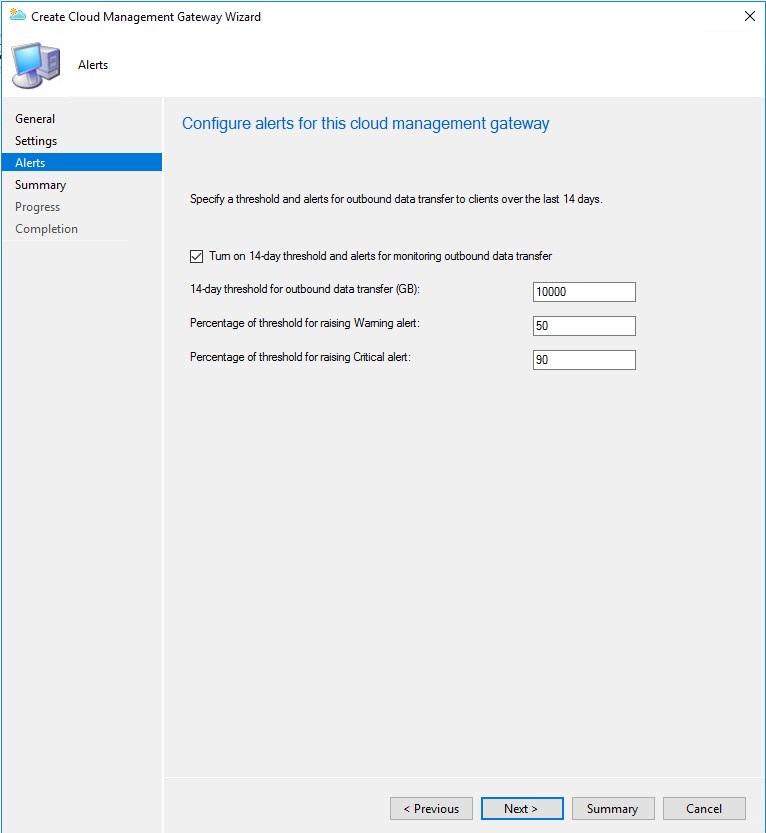
Set the threshold as needed
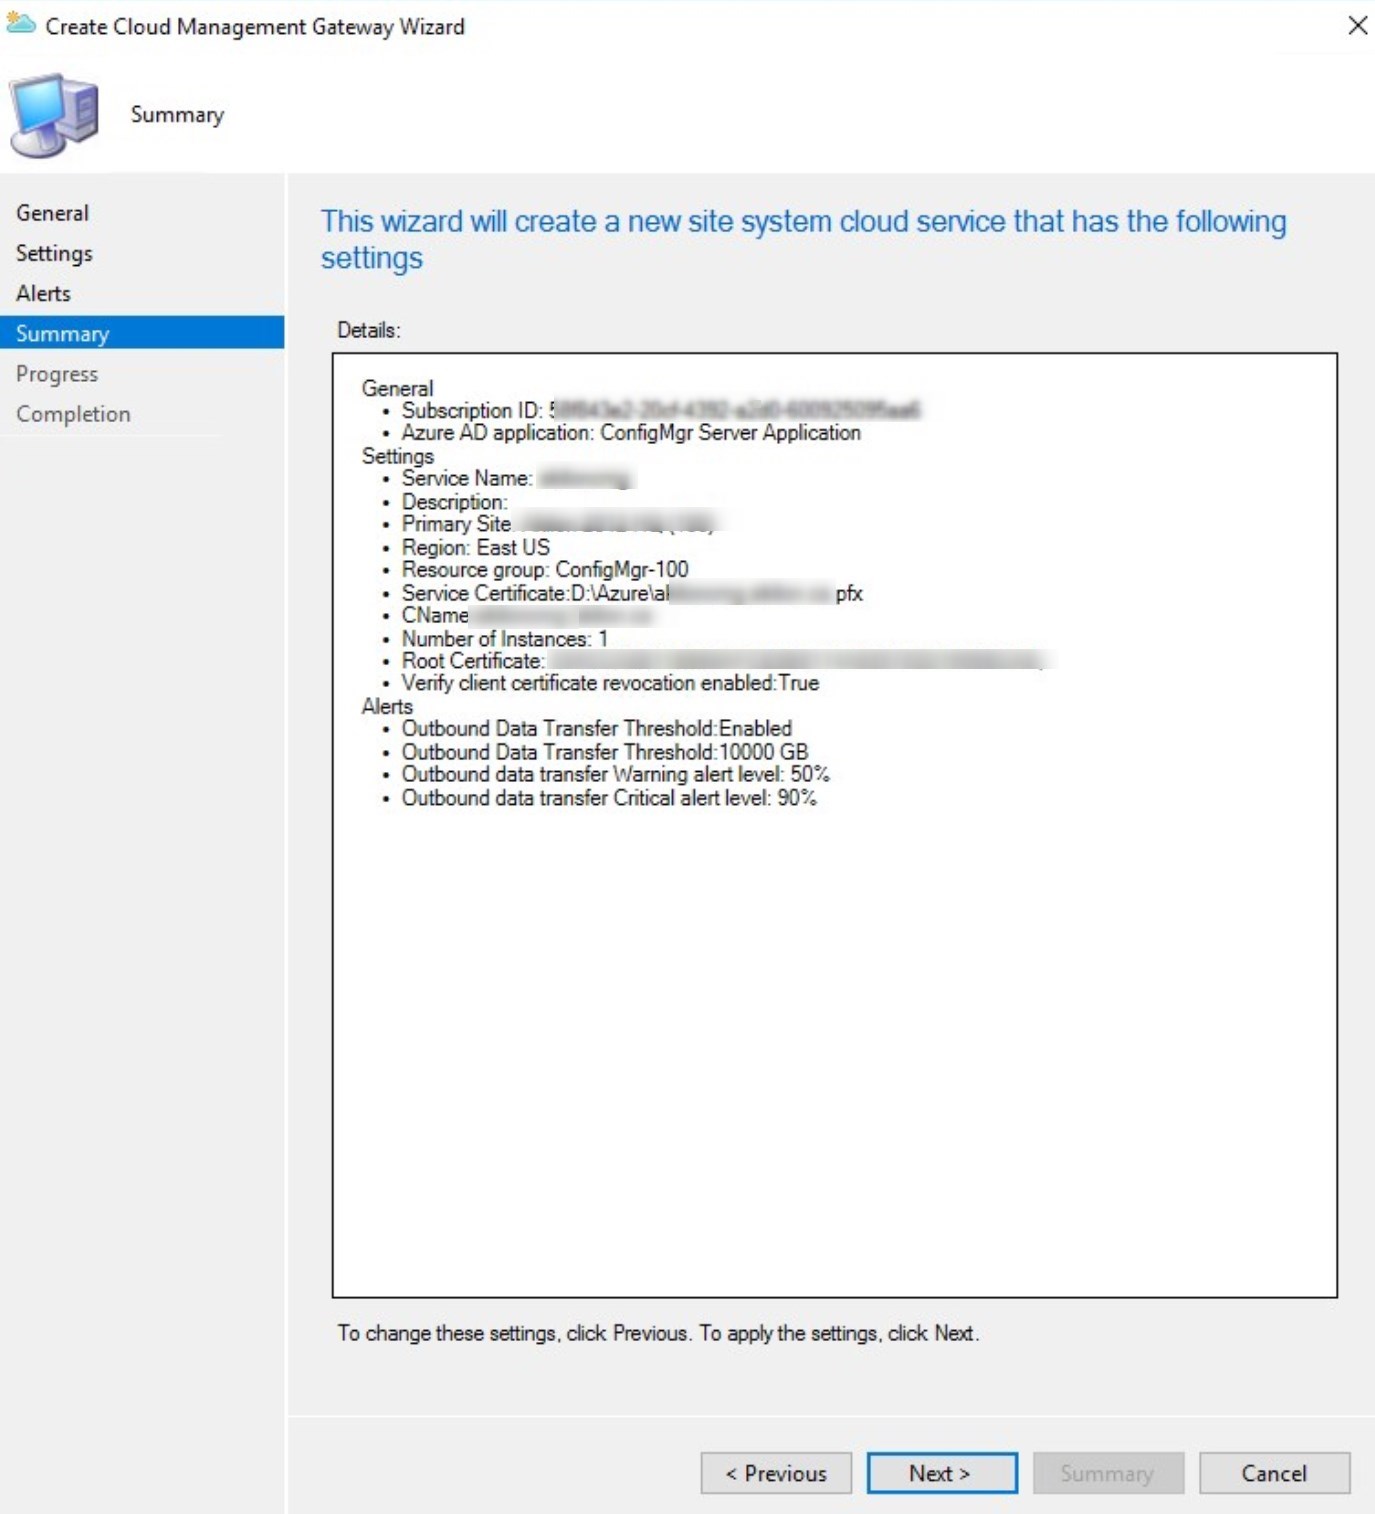
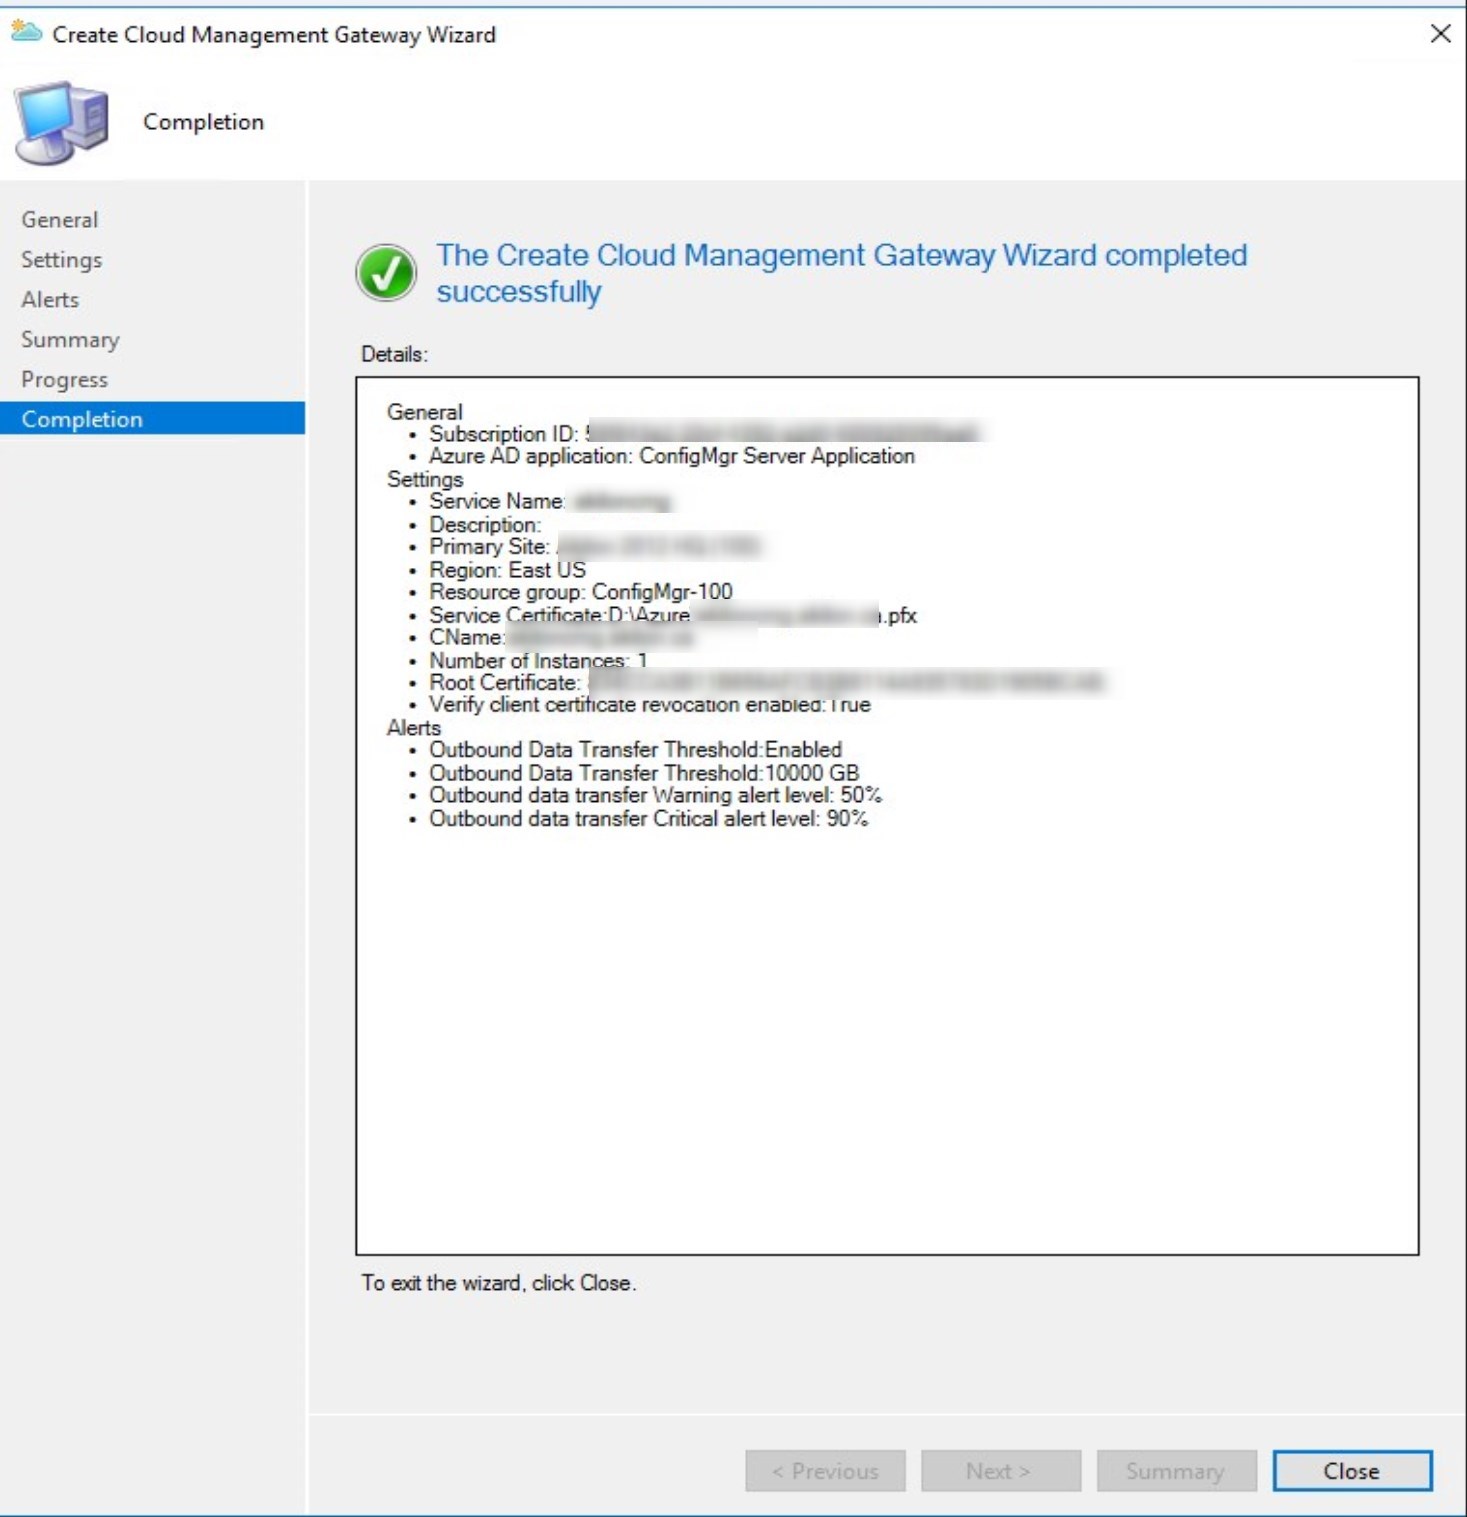
Summary, click Next
Click Close
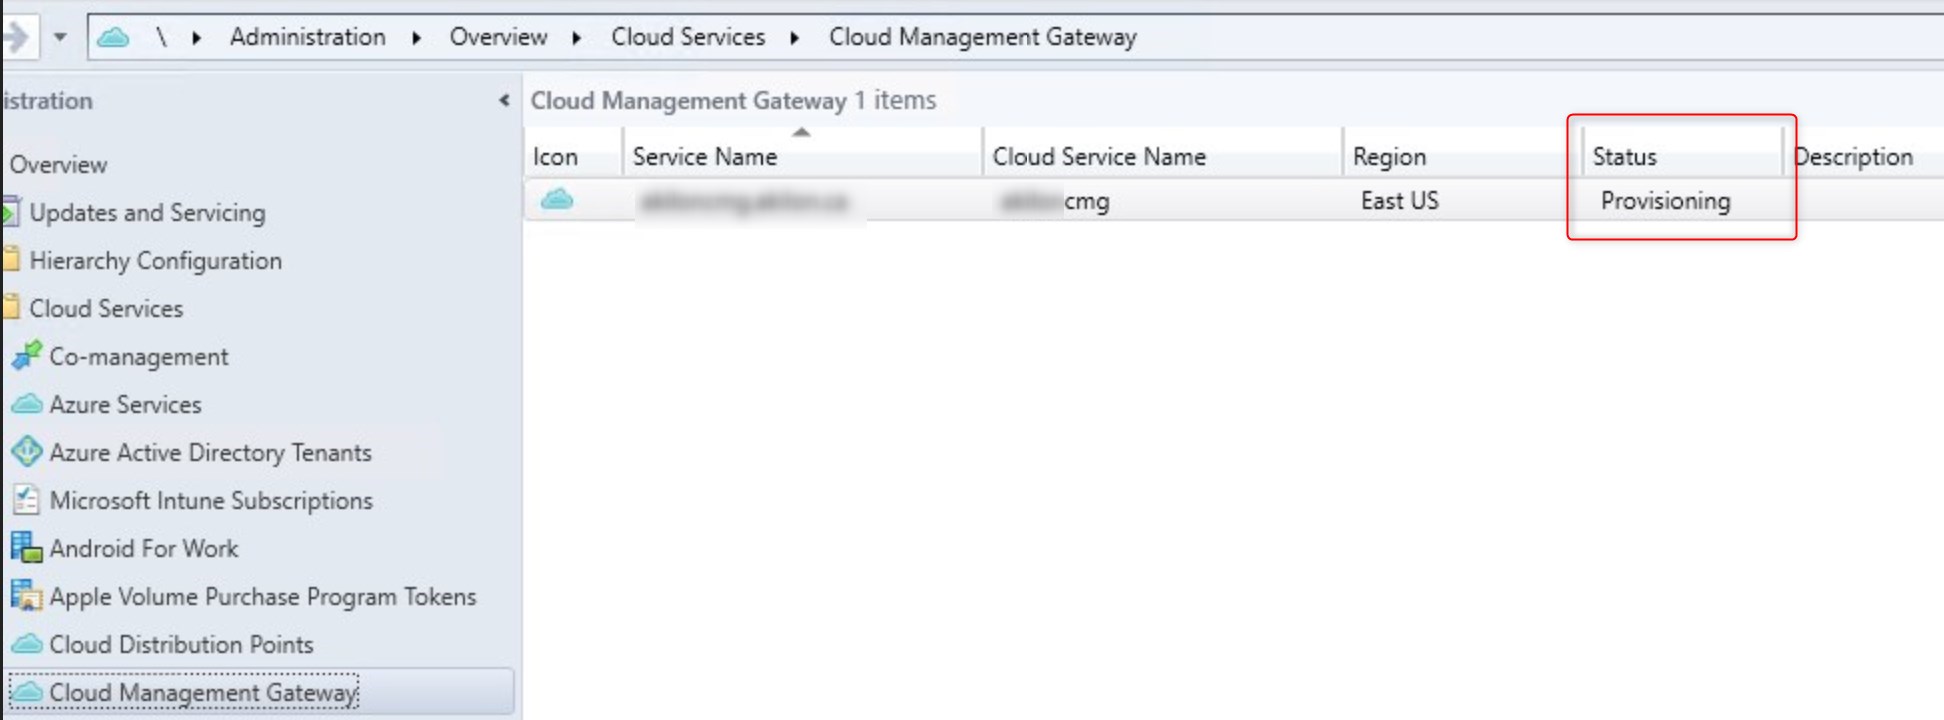
The Cloud Management Gateway will show as Provisioning for about 10 minutes
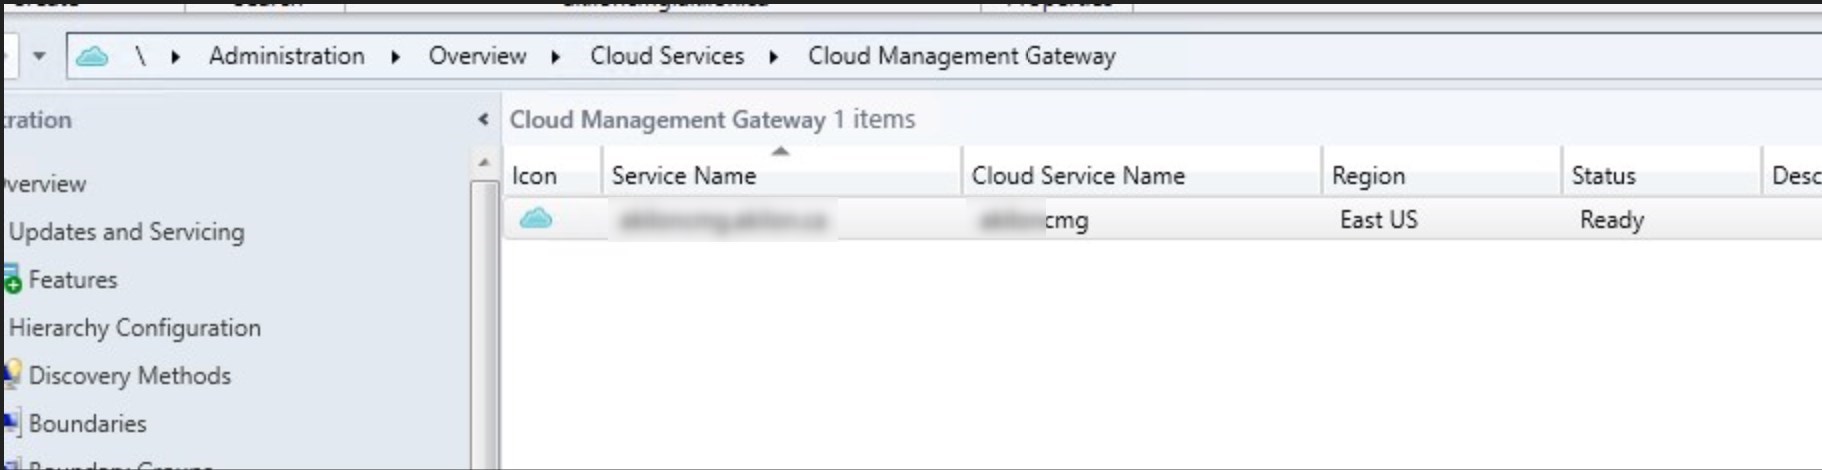
The Cloud Management Gateway is ready for next steps
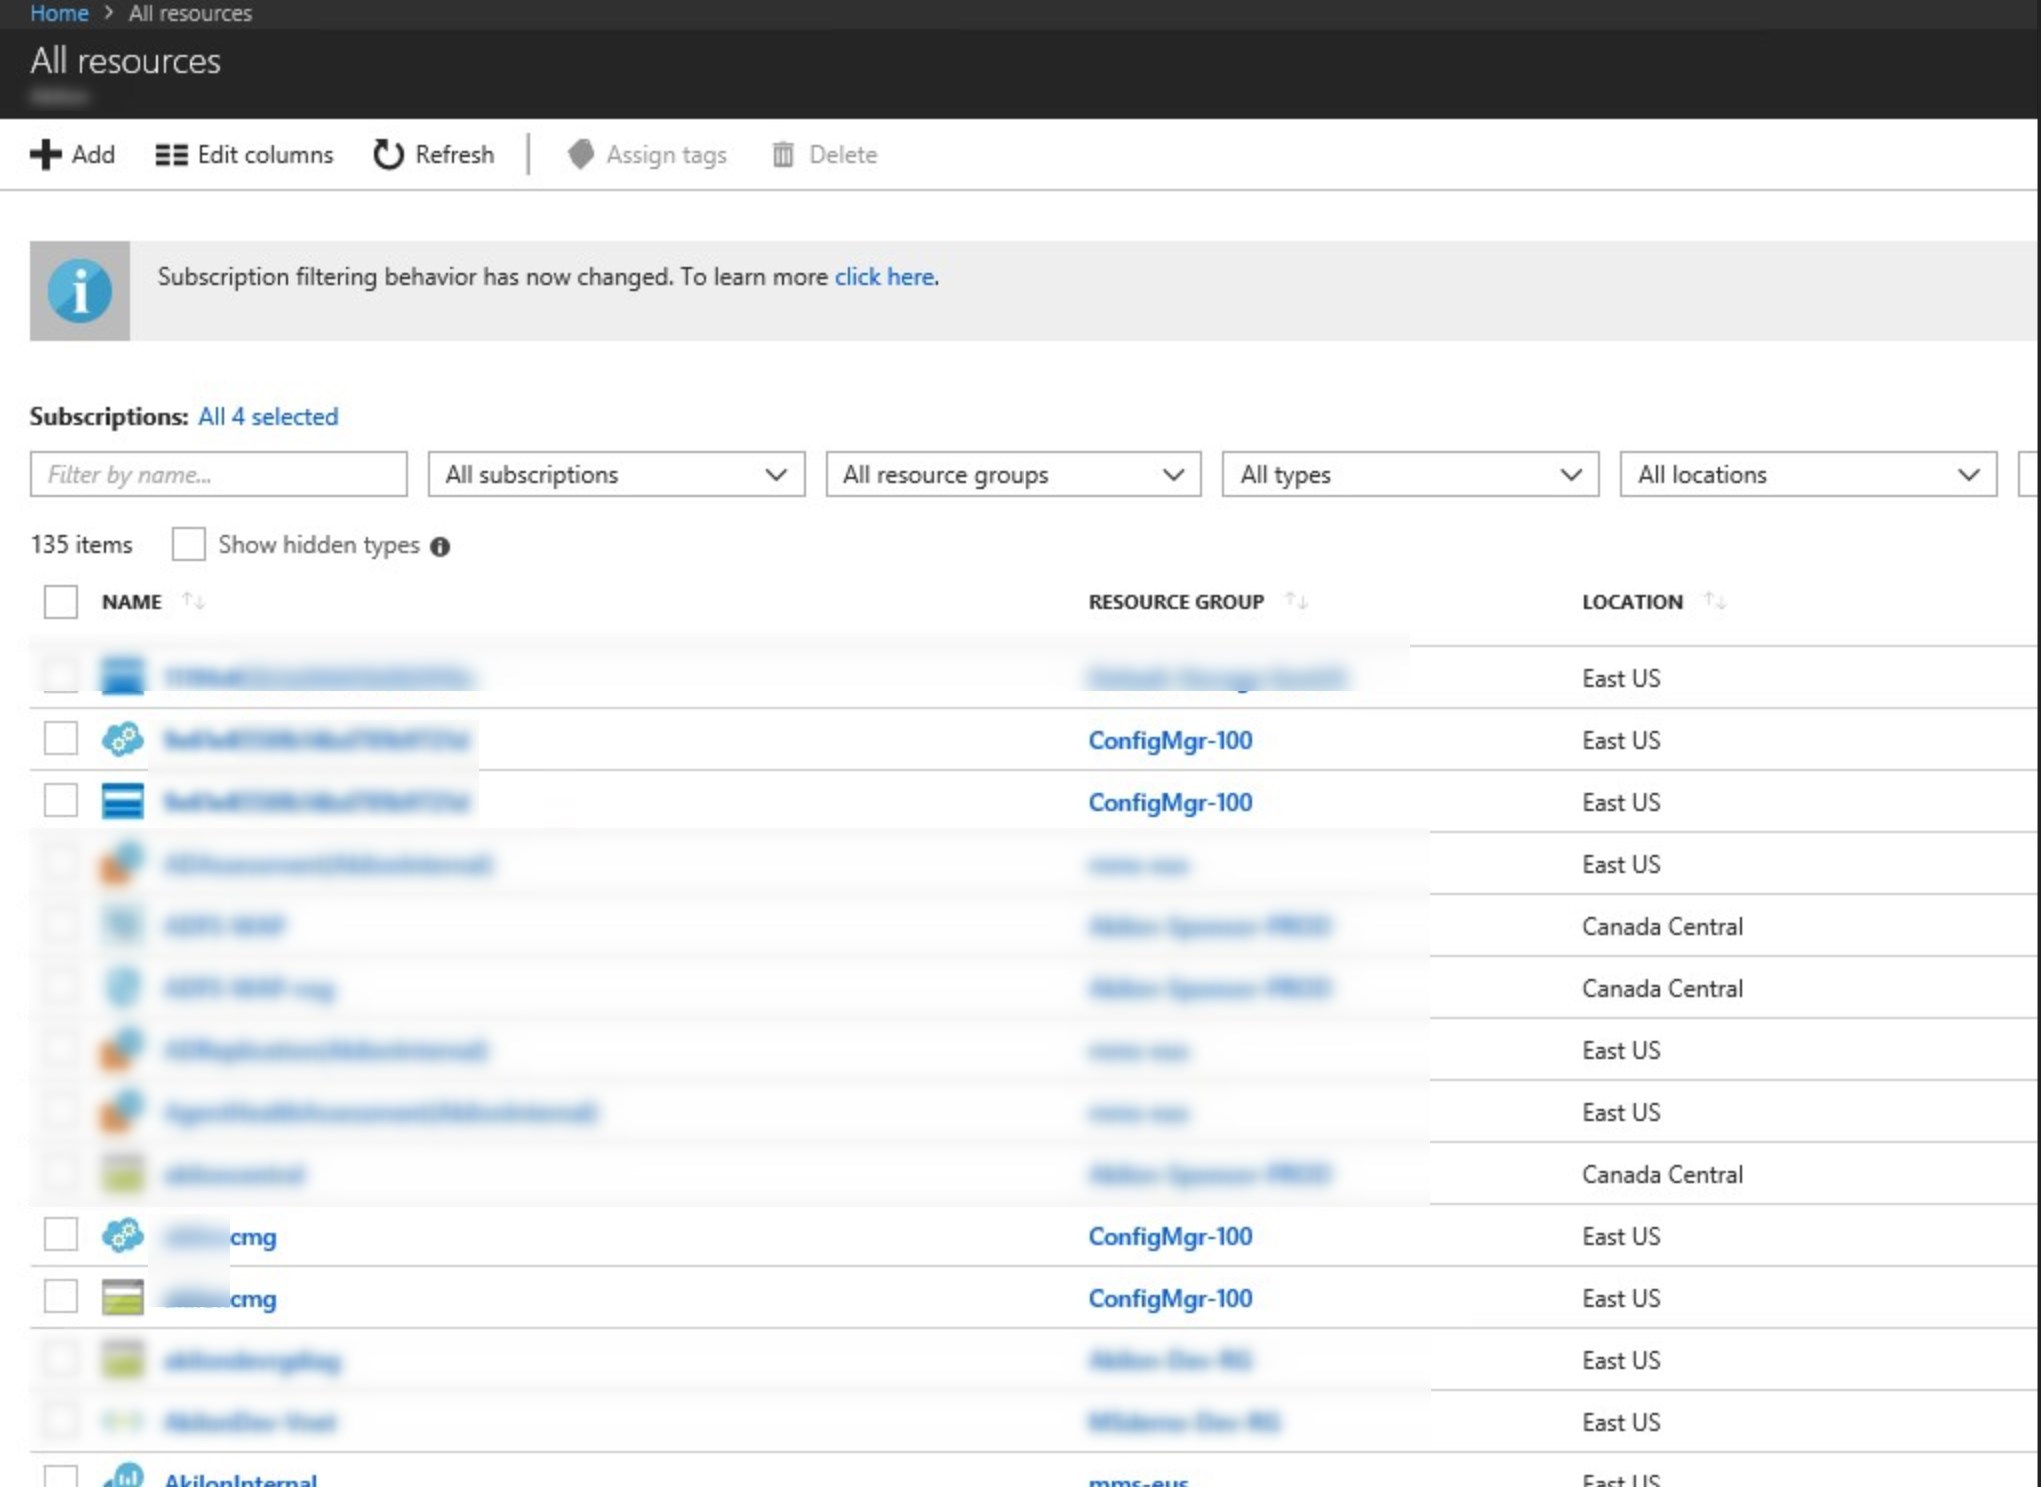
The cloud management gateway resources are also visible in the Azure portal.
Configure SCCM-generated certificates
This is a new feature from SCCM 1806, but still in Pre-Release. This means that this feature is still in development but is fully supported.
The goal of this feature is to enable an HTTP Management point and Software Update to support CMG traffic using HTTPS. Prior to SCCM 1806, it was needed to provide an HTTPS MP and SUP in order to connect those services to the Cloud Management Gateway.
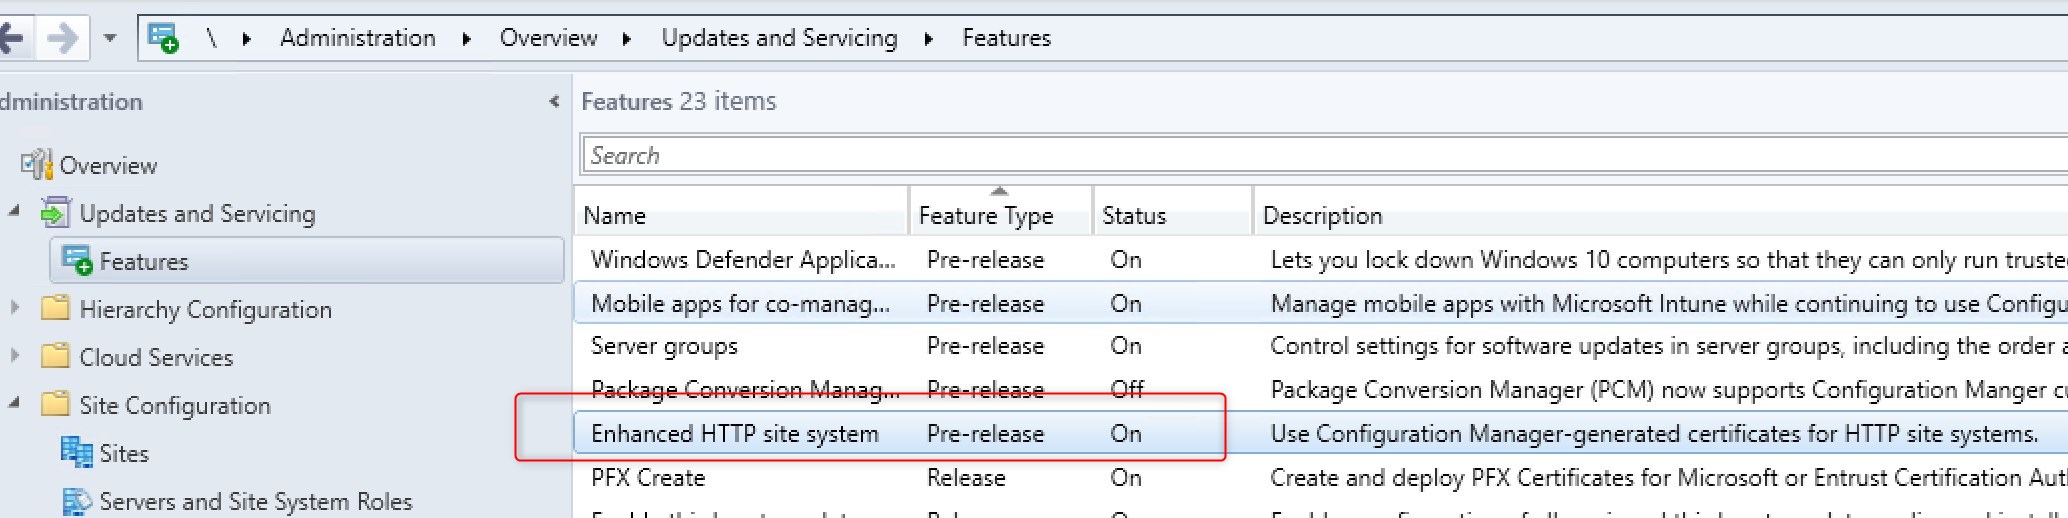
Go to Administration/Updates and Servicing/Features
Turn on the feature Enhanced HTTP site system
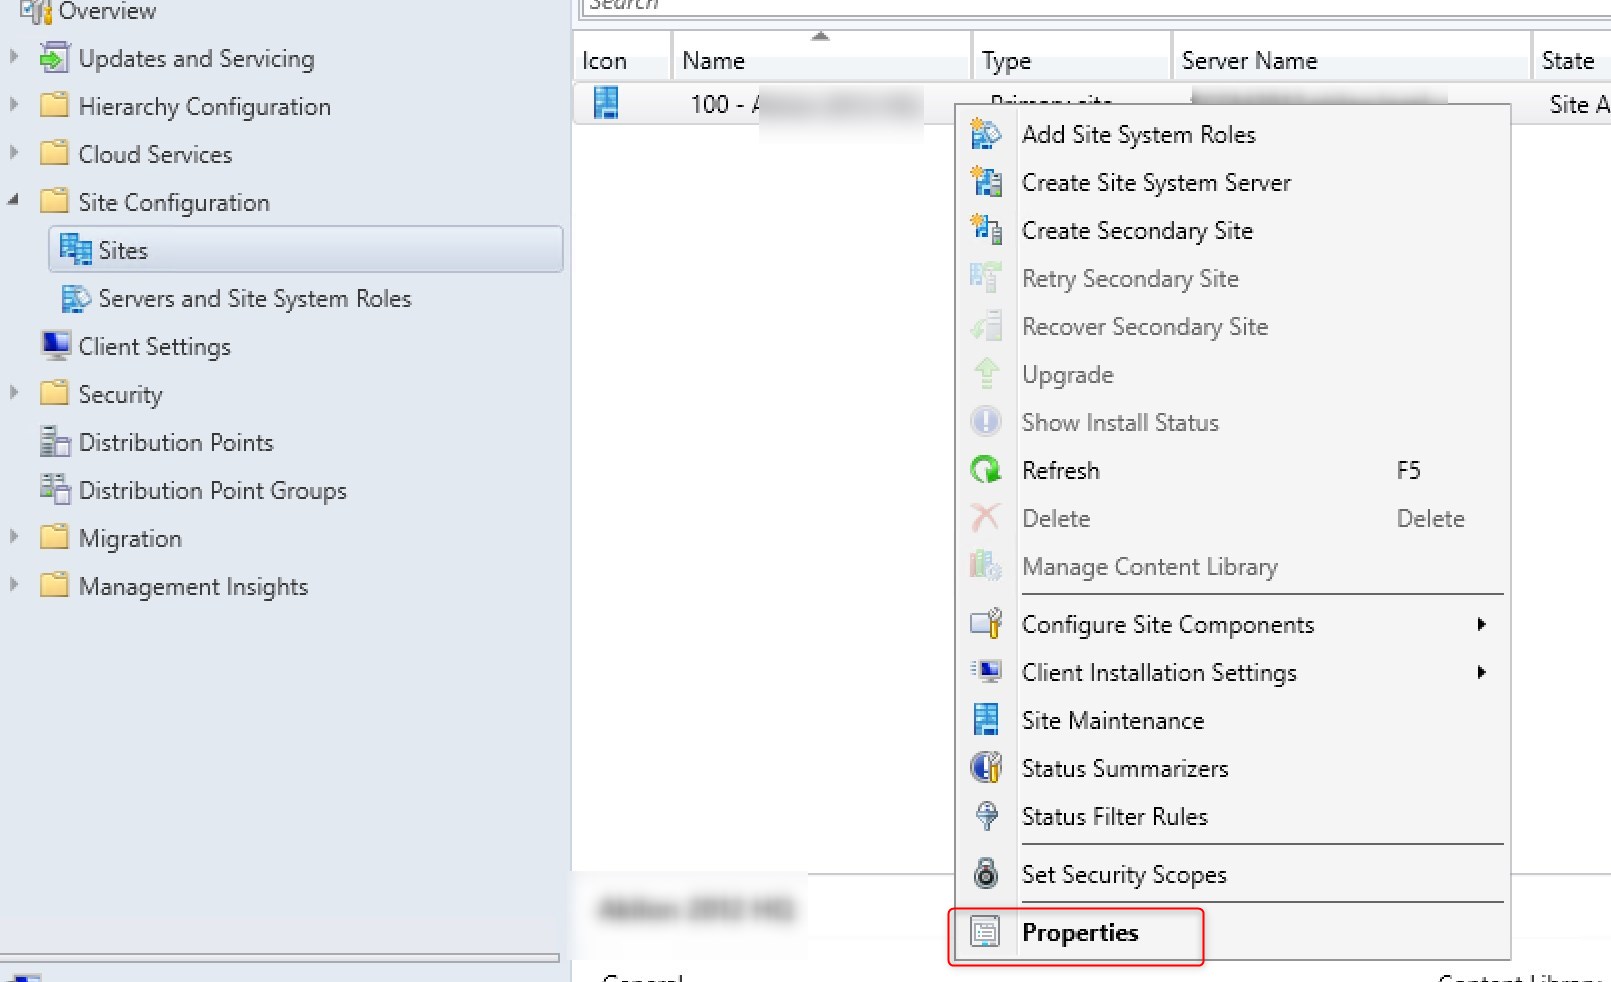
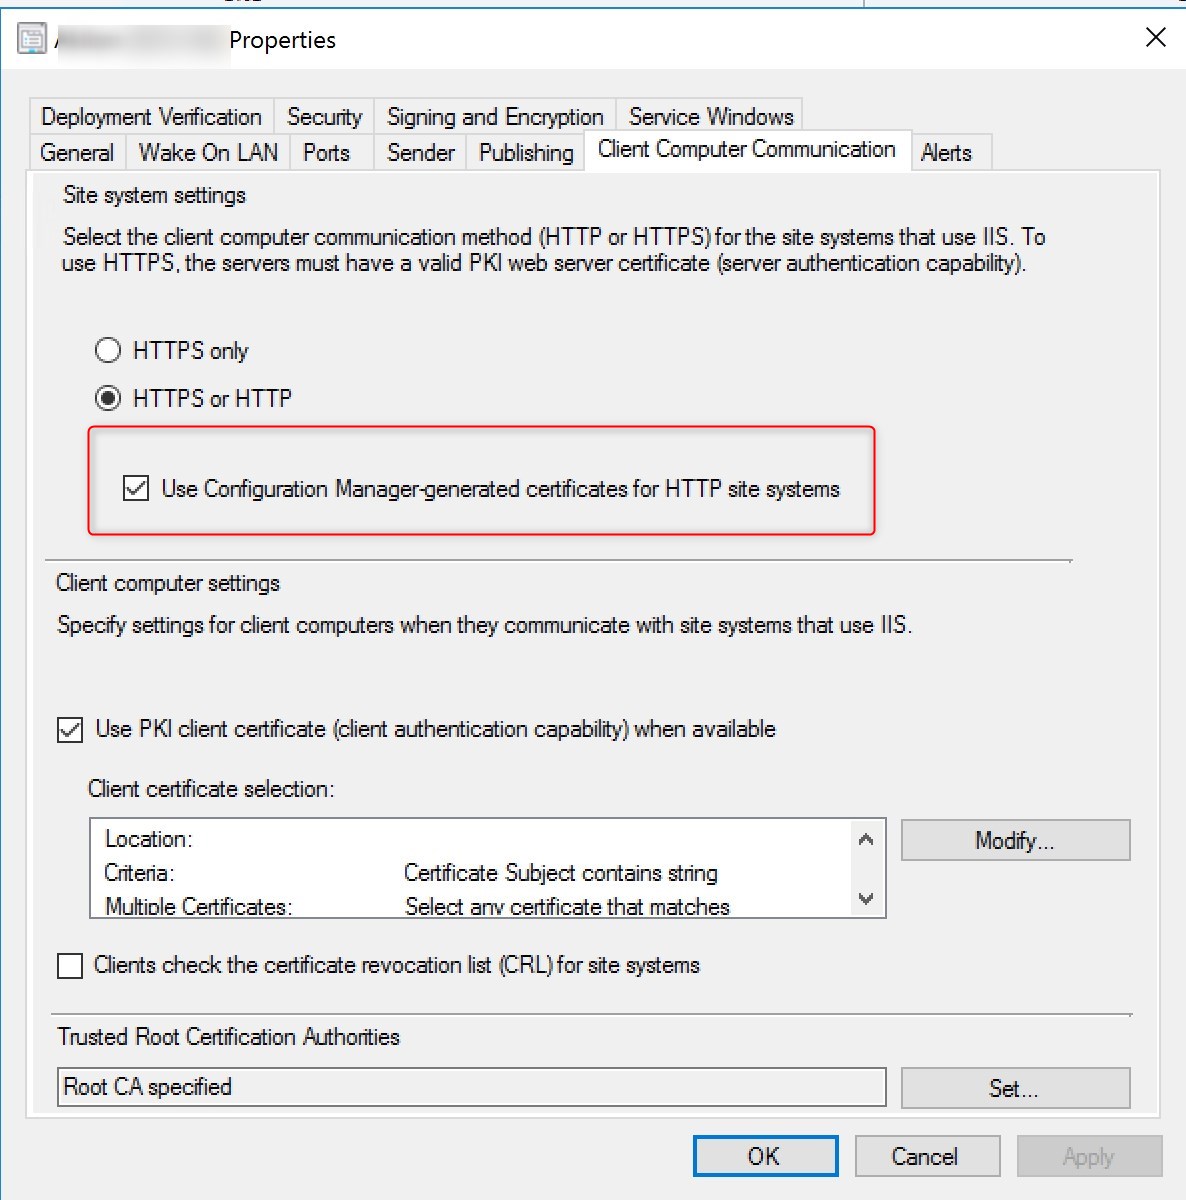
Go to Administration/Site Configuration/Sites and select properties on your site
Under the Client computer communication tab, check to box for Use Configuration Manager-generated certificates for HTTP Systems
For more detail on the SCCM-Generated certificate, see Docs.Microsoft.com
Add the Cloud Management Gateway Connector Point
The cloud management gateway connector point is a new site system role for communicating with cloud management gateway. Let’s add this role to our management point machine.
In the SCCM console, go to Administration / Site Configuration / Servers and Site System Roles
Select your server which will serve as your cloud management gateway connection point and select Add Site System Role
On the System Role Selection pane, select Cloud management gateway connection point
Your Cloud Management Gateway name and region will be auto-populated
Review your settings and complete the wizard
You can follow the installation progress in SMS_Cloud_ProxyConnector.log.
Configure System roles to communicate with the Cloud Management Gateway
Prior to SCCM 1806, it was not possible for the current Management Point and Software Update Point to remain in HTTP mode and support the Cloud Management Gateway.
Admins were in need of a new Management Point and Software Update Point configured in HTTPS mode or to switch current ones.
Now with the SCCM-generated certificate, a current HTTP MP and SUP can support the Cloud Management Gateway.
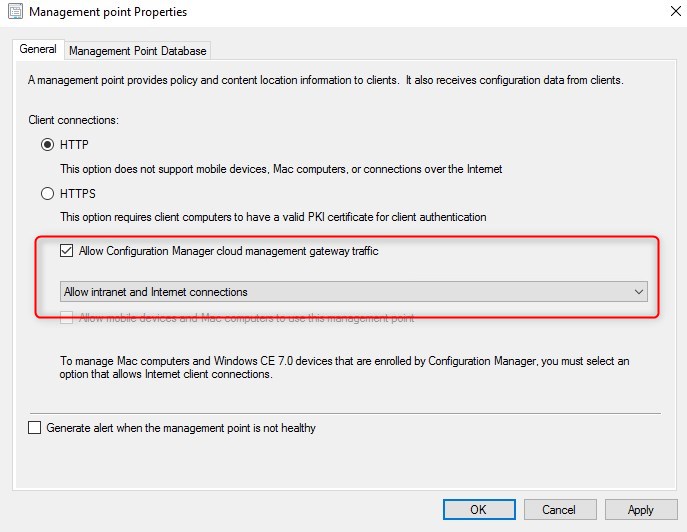
Under Administration/Site Configuration/Servers and site System roles, select the Management Point properties
Check the box Allow Configuration Manager cloud management gateway traffic. Notice that the Client Connections remain in HTTP
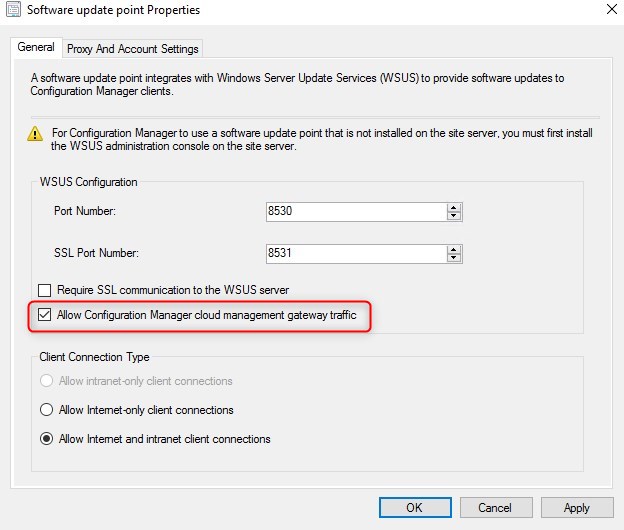
Under Administration/Site Configuration/Servers and site System roles, select the Software Update Point properties
Check the box Allow Configuration Manager cloud management gateway traffic. Notice that the Require SSL communication to the WSUS remains unchecked
Configure SCCM CMG Client settings
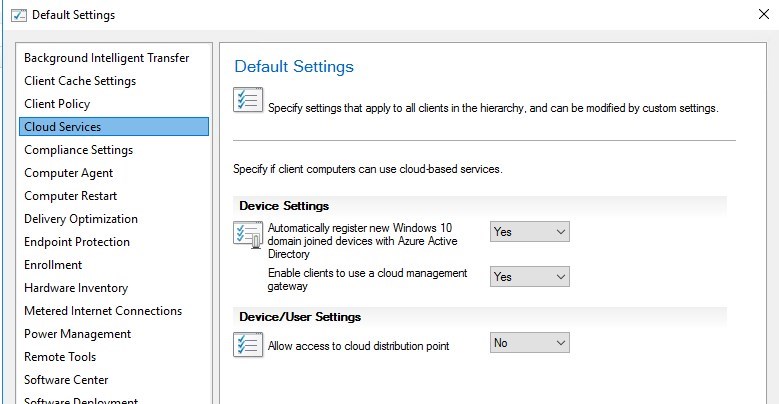
Under Administrations/Client Settings, under Cloud Services make sure Enable clients to use a cloud management gateway is set to yes.
Once configure, deploy your client settings to the desired clients.
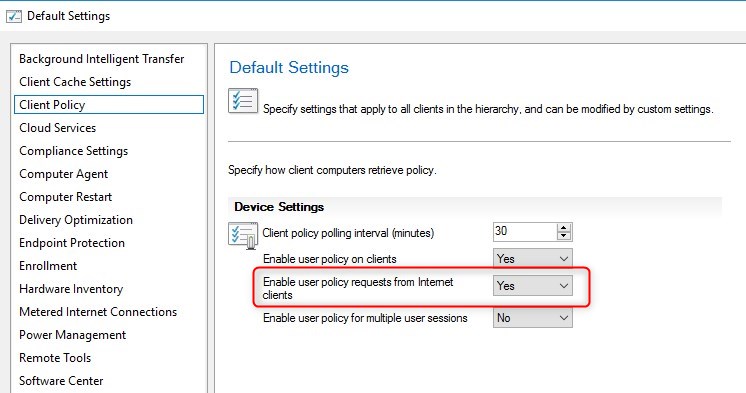
In order to be able to see Applications deployment targeted to users, the following client setting is also required.
Configure clients for cloud management gateway
We will now verify if clients are able to successfully communicate with our server via the SCCM Cloud Management Gateway.
On a client connected to the intranet, do a machine policy retrieval and restart the SMS Agent host.
On the Network tab of the Configuration Manager agent, the *.CloudAPP.net should be visible.
Additional information is available in the ClientLocation.log
Testing client connection to Cloud Management gateway
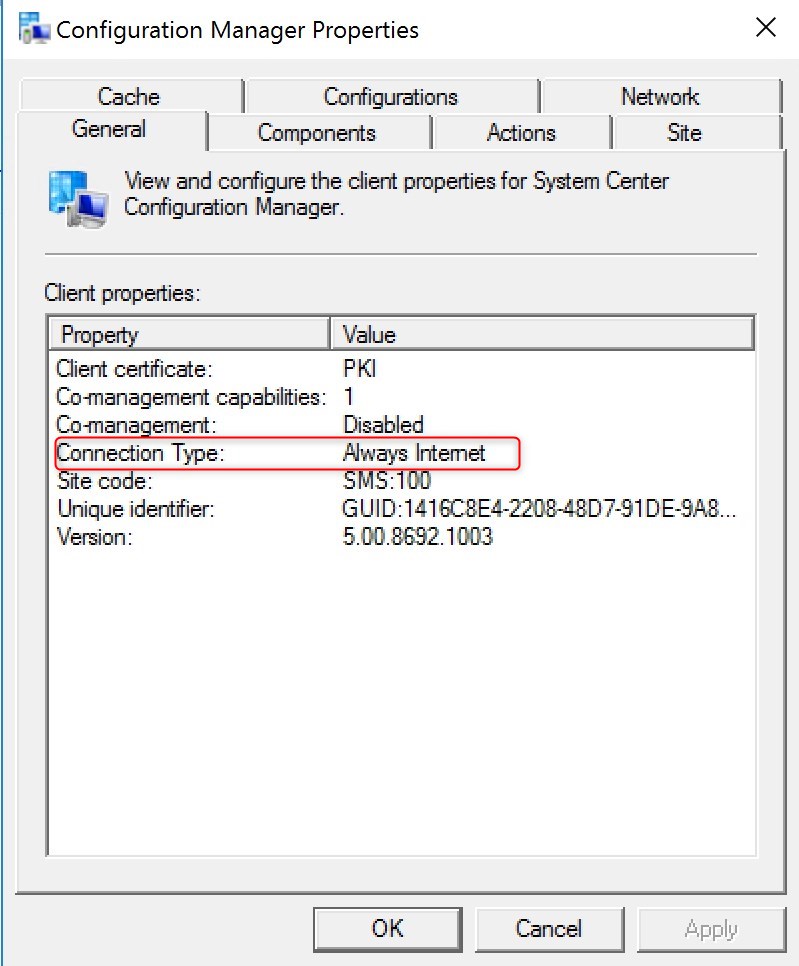
To test the cloud management gateway (CMG), get your machine on the internet … or force the SCCM client to be configured as Always Internet.
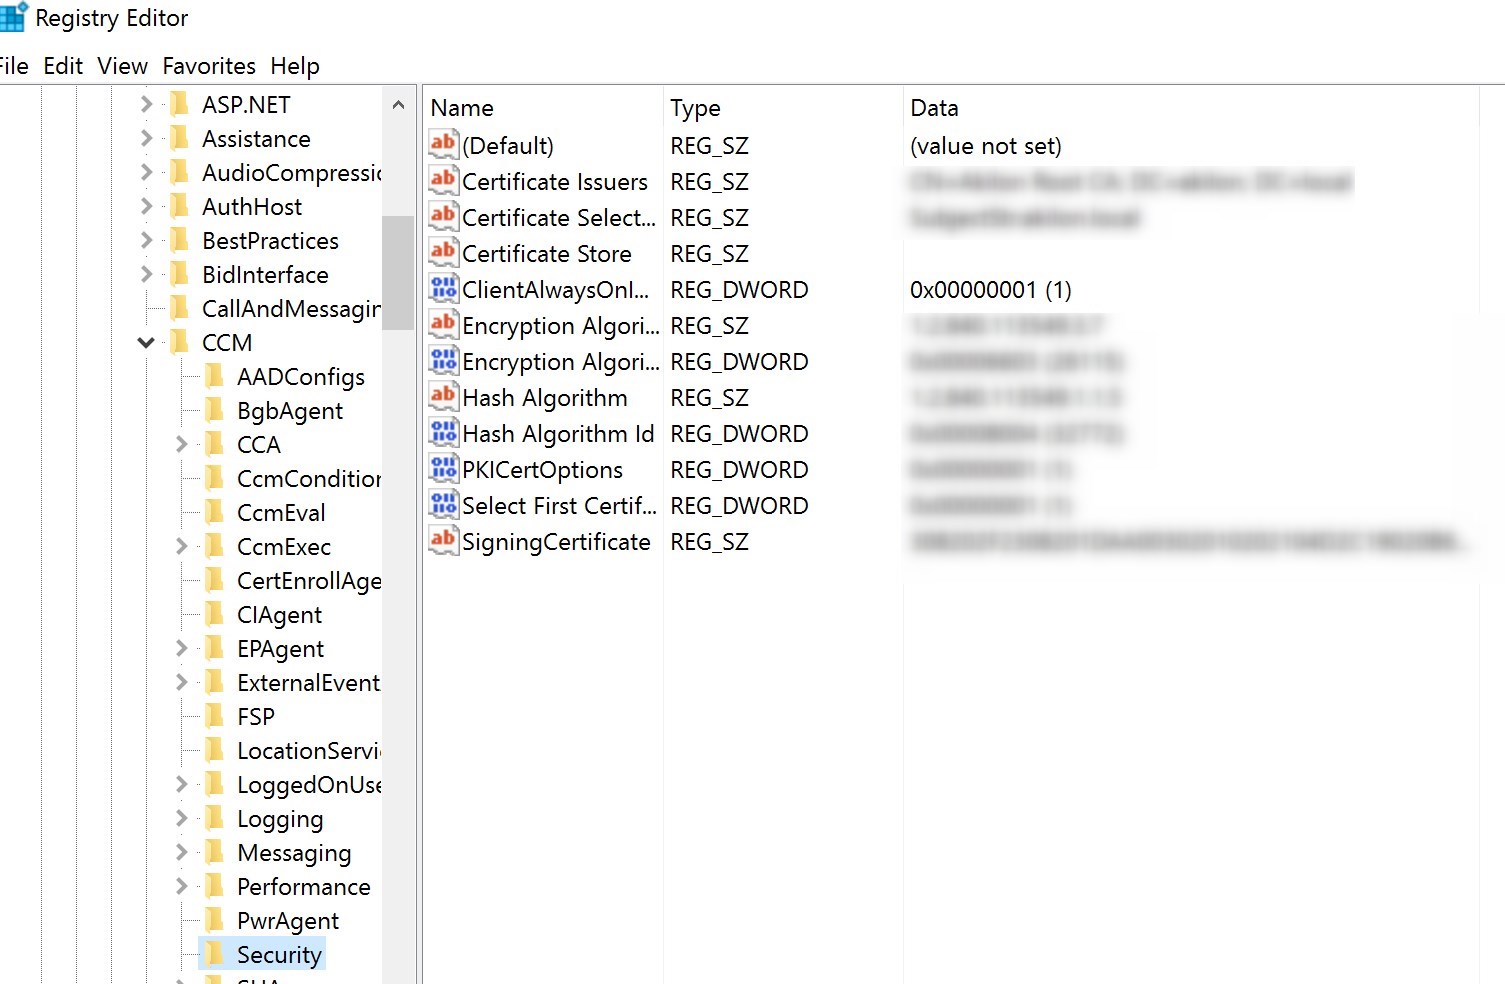
In the registry editor, set HKLM/Software/Microsoft/CCM/Security/ClientAlwaysOnInternet to 1 and restart the SMS Agent host service.
After the SMS Agent host service, the client will display connection type Always internet
From this point, you can try any of the supported features for the Cloud Management Gateway!
Warning
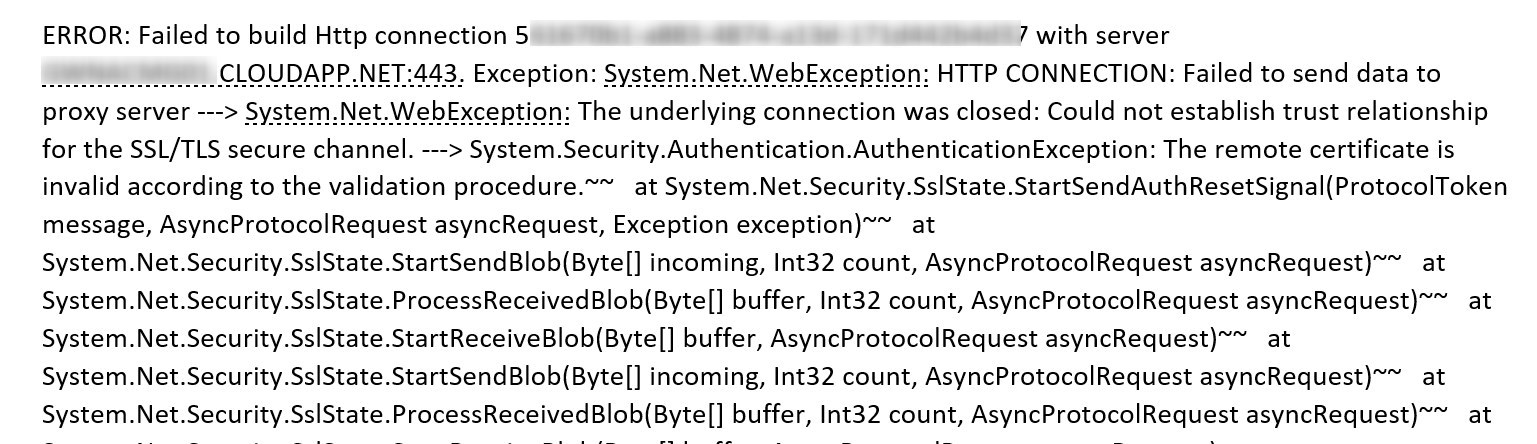
Make sure to whitelist the address XXXX.cloudapp.net in your Enterprise Firewall. We’ve seen an issue with Cisco Umbrella blocking traffic thus preventing the Cloud connector point to keep the connection to the cloud management gateway.
The following error found in the SMS_CLOUD_PROXYCONNECTOR.log was showing Failed to build HTTP connection with XXXXX.CloudApp.Net. The cloud management gateway check the connection every 60 seconds
If you want to easily identify your CMG client, we have developed a free report.
This was a big one, hope it helped! Are you using the Cloud Management Gateway ? Tell us your experience in the comment section.
Request a Quote
Please fill out the form, and one of our representatives will contact you in Less Than 24 Hours. We are open from Monday to Friday.
Never share sensitive information (credit card numbers, social security numbers, passwords) through this form.
Request Sent
Thank you for subscribing to our newsletter or requesting a quote.
You will receive our next month's newsletter. If you have requested a quote, we will get in touch with you as soon as possible.
Comment Sent
Thank for your reply!
Error
Something went wrong!
We use cookies to ensure that we give you the best experience on our website. If you continue to use this site we will assume that you are accepting it.


Thank for your reply!