

How to use SCCM Task Sequence Debugger
Founder of System Center Dudes. Based in Montreal, Canada, Senior Microsoft SCCM Consultant, 8 times Enterprise Mobility MVP. Working in the industry since 1999. His specialization is designing, deploying and configuring SCCM, mass deployment of Windows operating systems, Office 365 and Intune deployments.

Benoit Lecours
President


Share


Get the latest insights and exclusive content delivered to your inbox
Since SCCM 1906, SCCM Administrator has a new tool to debug a task sequence deployed to a computer. This feature is kind of special for me since I was part of the team that worked on an Hackaton project at the 2017 MVP Summit with Kerwin Medina. We won the first prize with this project, it was a bit different but it’s a huge step to see as a pre-release feature in SCCM 1906.
This blog post will describe how to use SCCM Task Sequence Debugger.
Prerequisite
Before you can use the feature, you need to enable the optional feature in the Administration pane.
- Open the SCCM Console
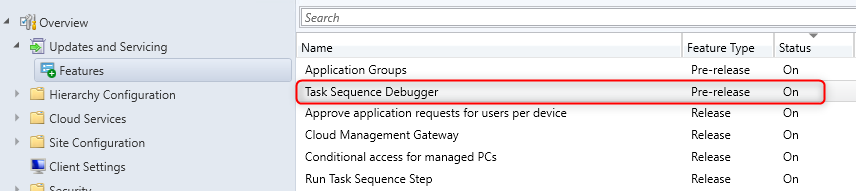
- Go to Administration / Updates and Servicing / Features
- Right-click and select Turn-on on the Task Sequence Debugger feature
- Once done, close the Console and re-open it
- Update your target client and boot image to the latest SCCM client version
Use the SCCM Task Sequence Debugger
First, let’s explain how it works. The Task Sequence debugger is a standalone tool that runs remotely on the target client where you deploy the task sequence. You first need to initiate the Debug action which will launch the deploy task sequence wizard as if you regularly do. Once deployed on the client, the Task Sequence is initiated from Software Center and the tool will launch. Let’s see that in action :
- In the SCCM Console
- Go to Software Library / Operating Systems / Task Sequences
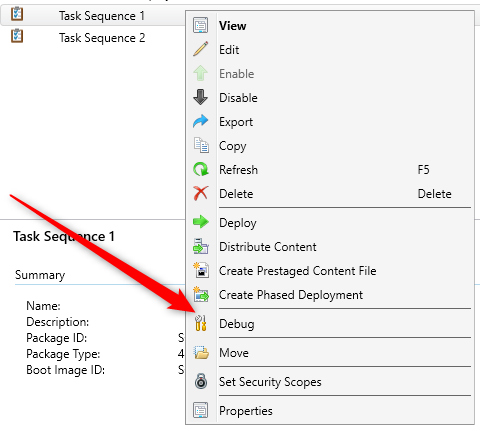
- Right-Click the Task Sequence you want to debug
- Select Debug in the menu. If it’s not an option, make sure that you’ve enabled the feature. See the previous section.
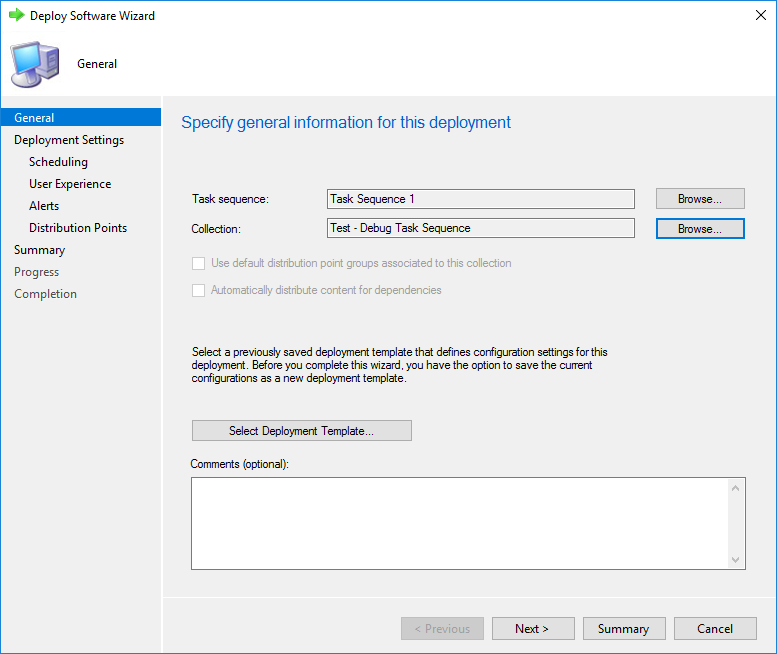
- The Deploy Software Wizard appears
- Select your collection which contains your target client to debug
- When selecting the collection, only collection with less than 10 members will be displayed
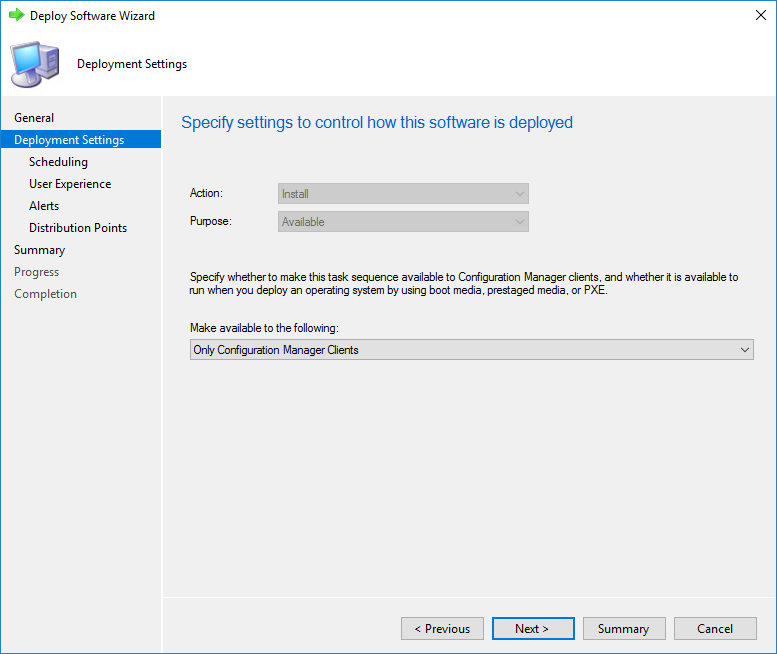
- In Deployment Settings, leave it as is. The debug task sequence feature is only possible as Available deployment and ran into Windows.
Edit 09/06 – Windows PE can also run the debugger.
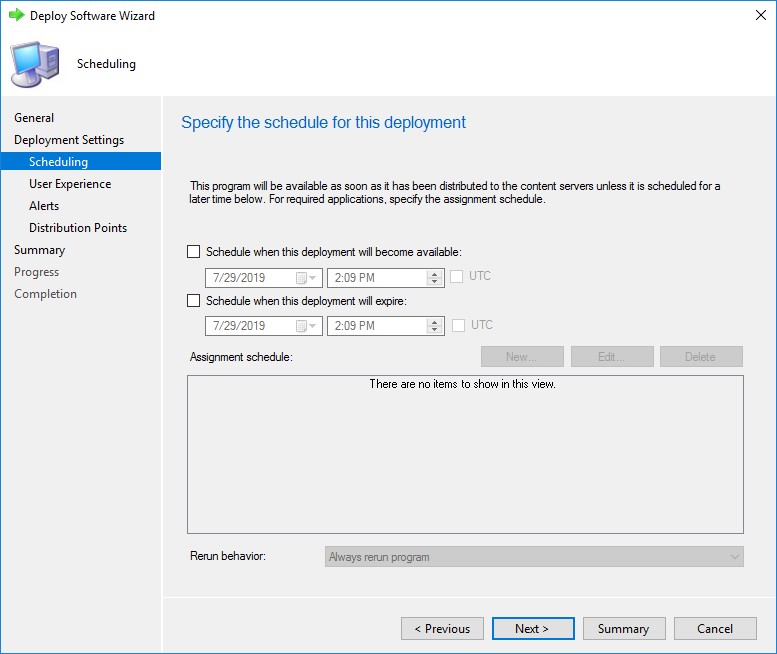
- In the Scheduling tab, click Next
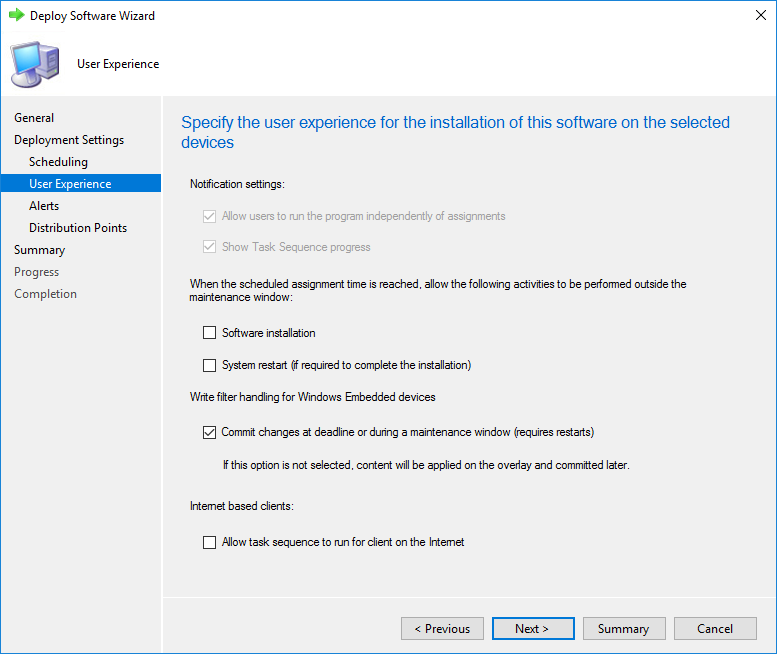
- In User Experience, click Next
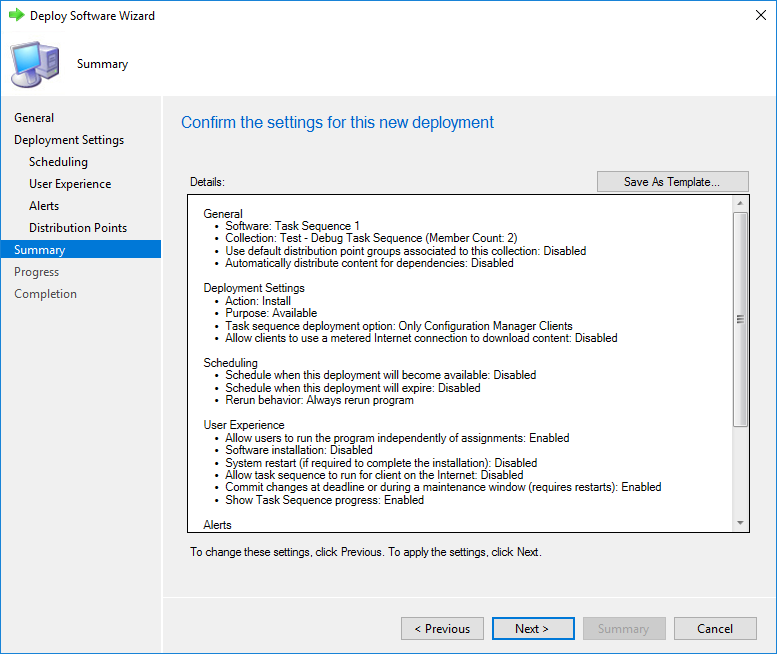
- Review other tab and complete the wizard
Test the Task Sequence Debugger
It’s now time to try the tool. On a Windows machine where you’ve updated your client to SCCM 1906 :
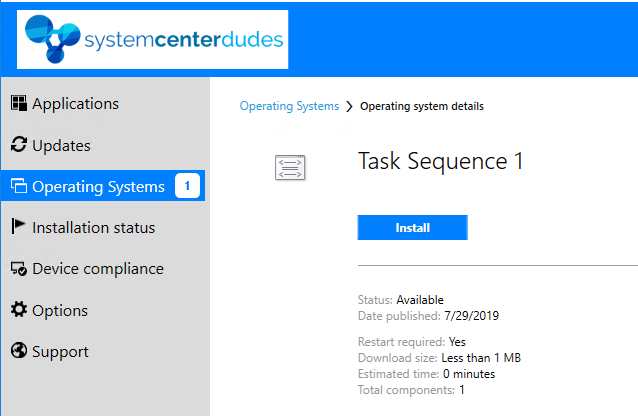
- Open Software Center
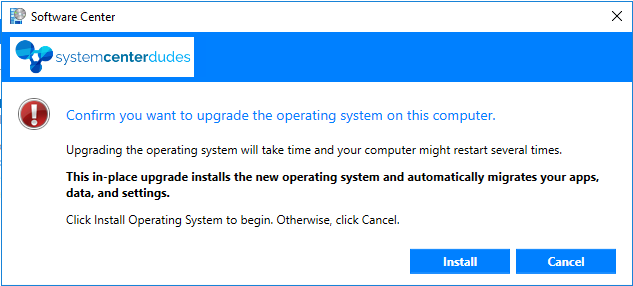
- Select your Task Sequence and click Install
- Accept the warning, click Install
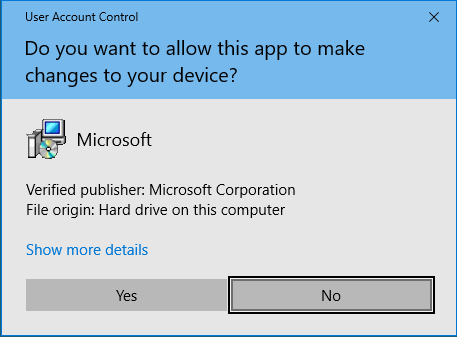
- A UAC prompt will show, this comes from the TSD.exe executable which is the Task Sequence Debugger, click Yes
- The SCCM Task Sequence debugger now starts and you have multiple options at the top of the screen.
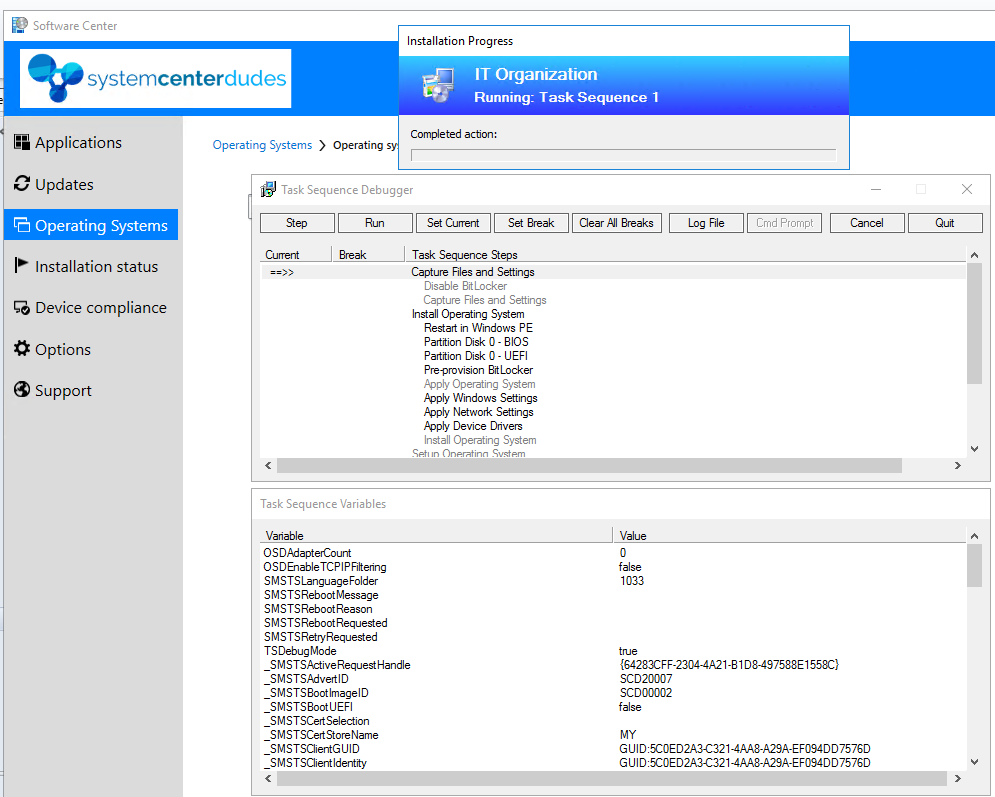
- The options are well described in the Technet article
- The only warning we would add is to make sure to understand the Cancel and Quit button. In our first test, we closed the wizard using the Quit button and end up reimaging our machine.
- Cancel: Close the debugger, and fail the task sequence.
- Quit: Detach and close the debugger, but the task sequence continues to run normally.
This tool is great to debug your task sequence. The Variable section at the end can show you the value of those variables on a specific machine.
We see lots of potential new features in the upcoming SCCM releases.
Share
Get the latest insights and exclusive content delivered to your inbox


Stephen
04.29.2020 AT 03:33 PMbestringtoness.com
11.06.2019 AT 01:35 AMMichael
08.13.2019 AT 07:15 AMBenoit Lecours
09.06.2019 AT 07:55 AMGary Knigge
07.30.2019 AT 02:24 PMBenoit Lecours
09.06.2019 AT 07:55 AM