

Create your first SCCM Dashboard with Power BI Desktop
Founder of System Center Dudes. Based in Montreal, Canada, Senior Microsoft SCCM Consultant, 8 times Enterprise Mobility MVP. Working in the industry since 1999. His specialization is designing, deploying and configuring SCCM, mass deployment of Windows operating systems, Office 365 and Intune deployments.

Benoit Lecours
PresidentTable of Content


Share


Get the latest insights and exclusive content delivered to your inbox
Beginning with SCCM/MEMCM 2002, it’s possible to Integrate Power BI Report Server to an existing Reporting Point or to a site that doesn’t have a reporting point installed. Doing so will give you the ability to manage your Power BI Dashboard the same way you manage your SSRS report. All done directly from the console makes it easier to deploy and edit your existing dashboard and to create a new one.
You may already use many SSRS reports to monitor and visualize your SCCM data. Microsoft has released Power BI a couple of years ago and has its advantage over SSRS
- A large amount of data can be processed
- Rich visuals
- Less engineering resources to use
- It can be embedded into your own custom apps
System Center Dudes team has decided to develop a series of Power BI dashboard. We think that, if you have the skills, the visualization of your SCCM data should be done using Power BI.
So… you’re ready to give this a try but are unsure where to start? We got you covered! This blog post will describe how to create your first SCCM Dashboard with Power BI Desktop.
SCCM Power Bi Dashboard Creation Requirements
The tool needed to develop a Power BI dashboard is the Power BI desktop. We assume that you already have a fully functioning SCCM server.
We will start by installing Power BI Desktop on a computer:
- Download Power BI Desktop from the Microsoft download center
- Execute PBIDesktop_x64.msi, click Next

- Accept the license terms and click Next

- Select the Installation Directory and click Next

- Click Install

- Wait for the process to finish and close the installation wizard


Power BI Desktop
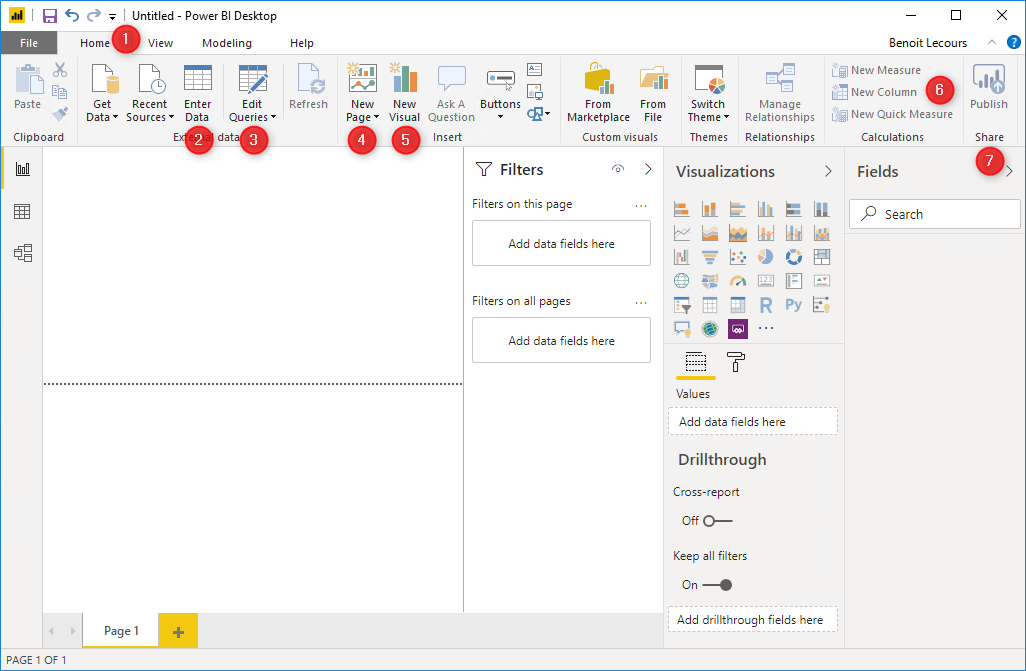
Once you launch Power BI Desktop, at the top of the page is a ribbon of various tabs. The Home (1) tab provides various common functions. You can get new data (2), edit your current data (3), add new pages (4), visuals, or objects (5), create new measures and columns (6), or publish your report to Power BI on the internet. (7)
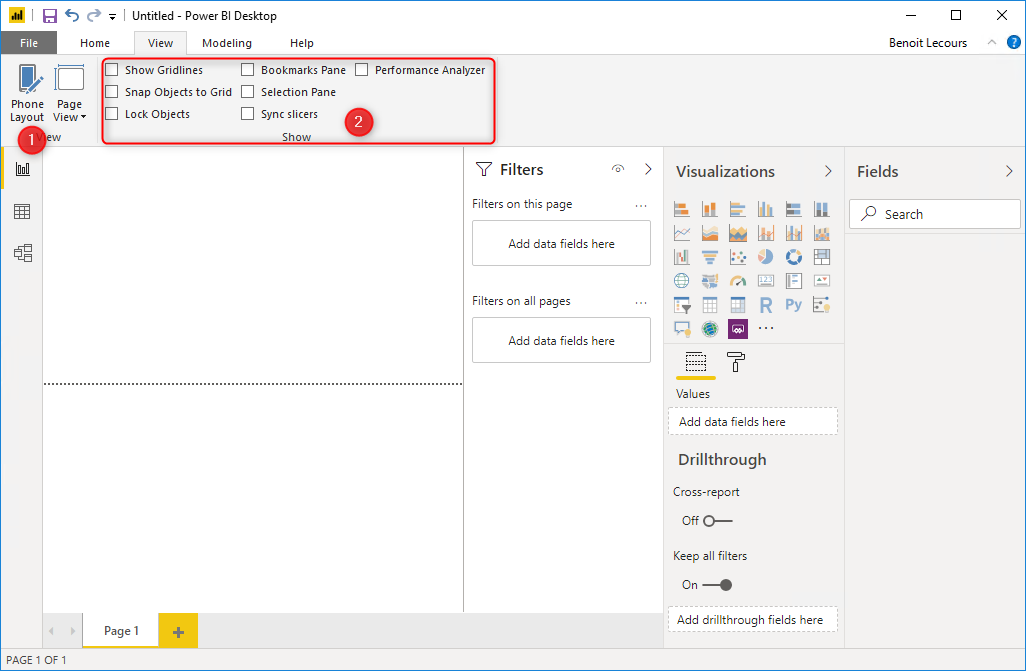
The View tab allows you to change from Desktop View to Phone View (1) or make other adjustments to the view settings. (2)
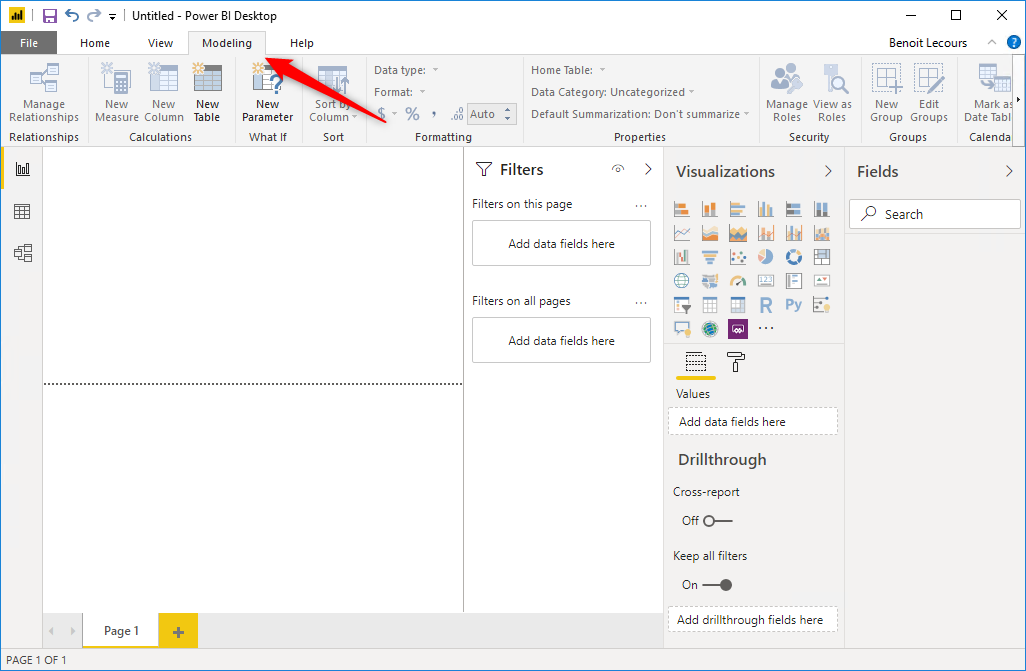
The Modeling tab allows you to manipulate the data you’ve imported to Power BI.
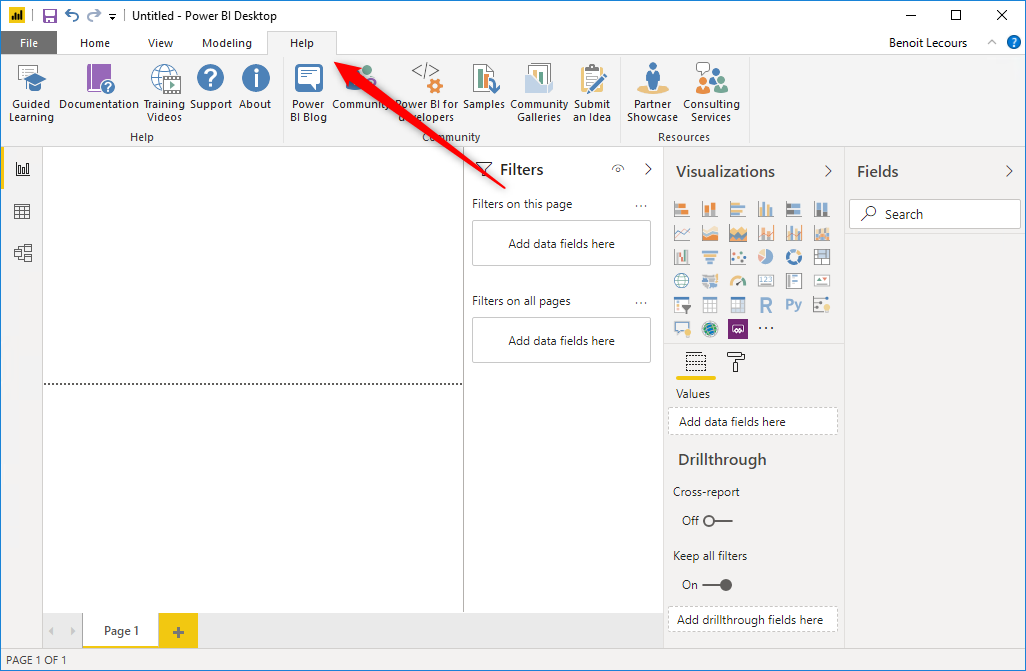
The Help tab offers links to a variety of Power BI help and training materials.
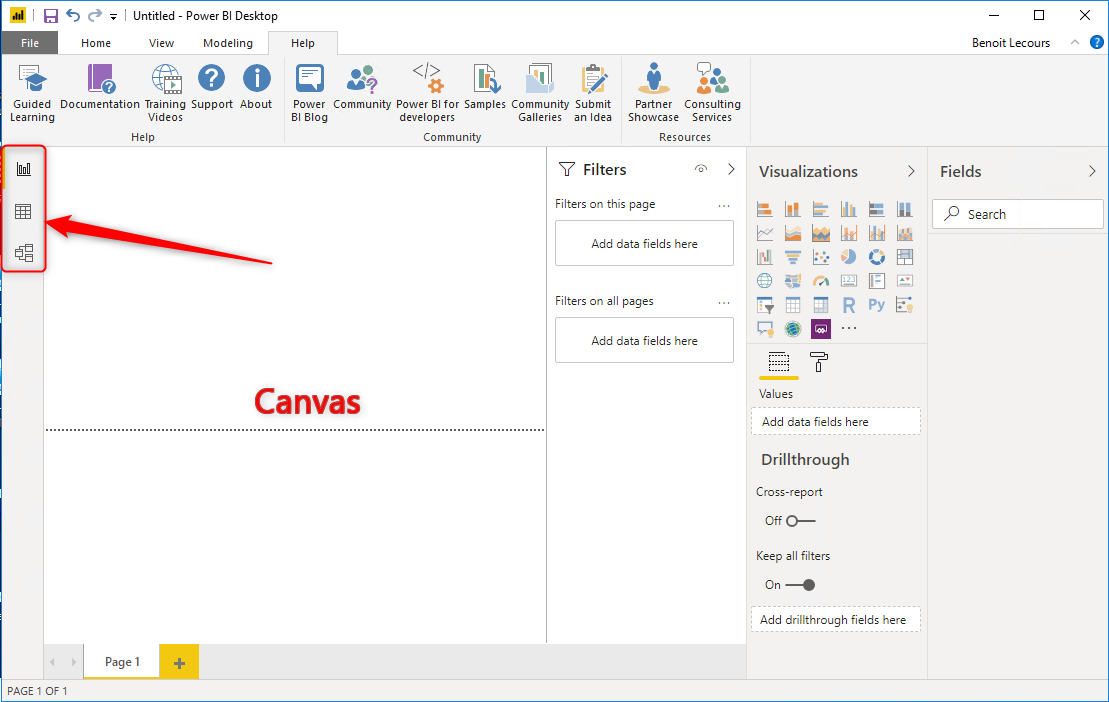
Below the ribbon, we can see three icons on the left side of the screen.
These icons are used to switch between the three options for viewing our data in Power BI Desktop. The default view is Report View, and the white space is called the Canvas. This is where we’ll build the visualizations that make up our Power BI reports.
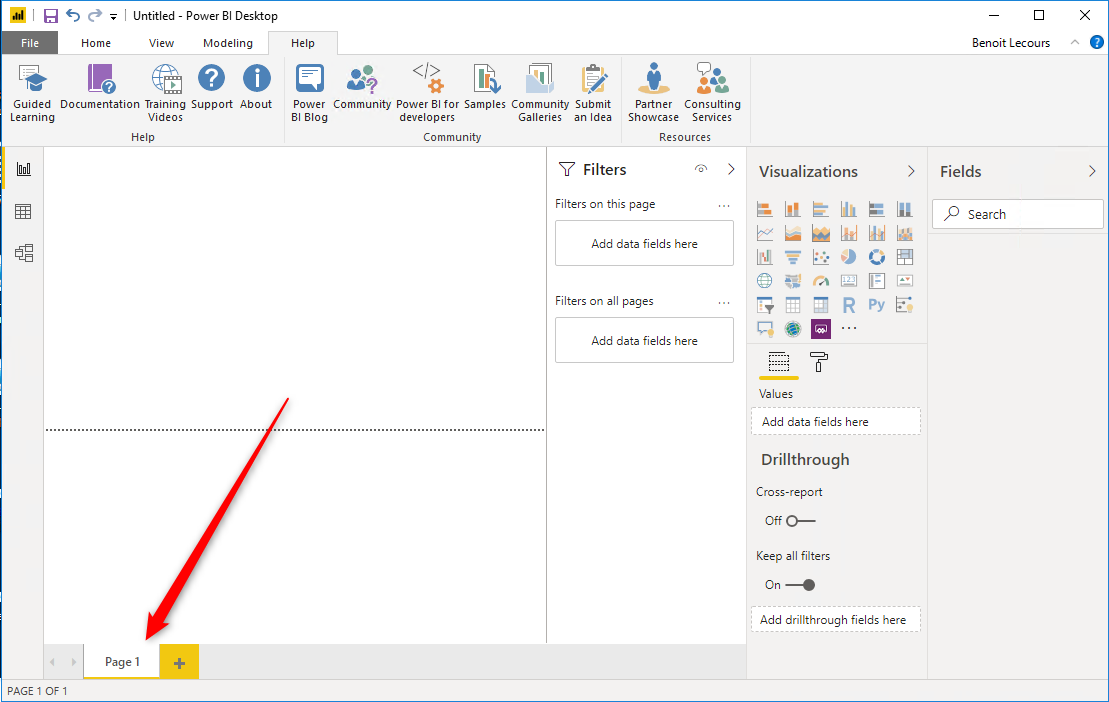
At the bottom of the report are the page controls. Here, we can add new pages, delete existing ones, or rename pages by double-clicking on the title.
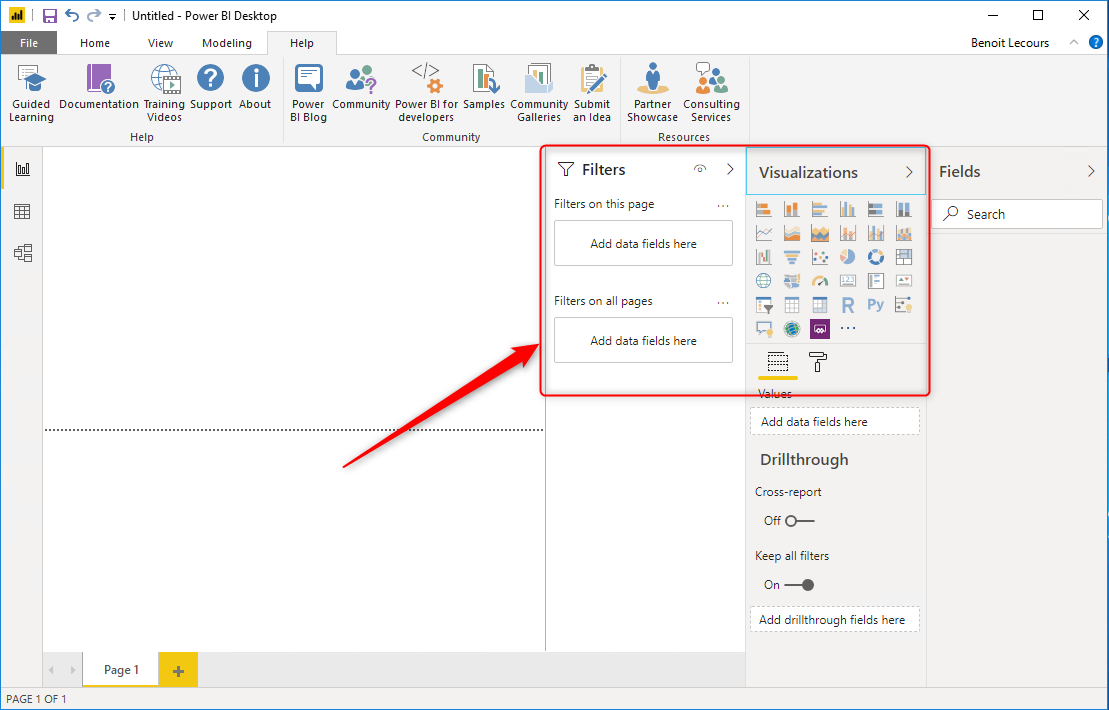
On the right, you have Filters and Visualizations options. We’ll come back to this later on this post.
Connect Power BI to your SQL server
Now that you’re comfortable with the UI, we can link our SCCM SQL server which is the first step to start building your dashboard.
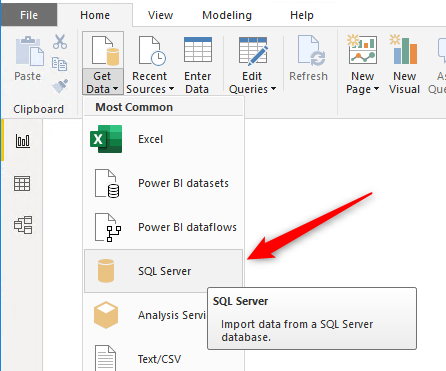
- In the Home tab, click Get Data and select SQL Server
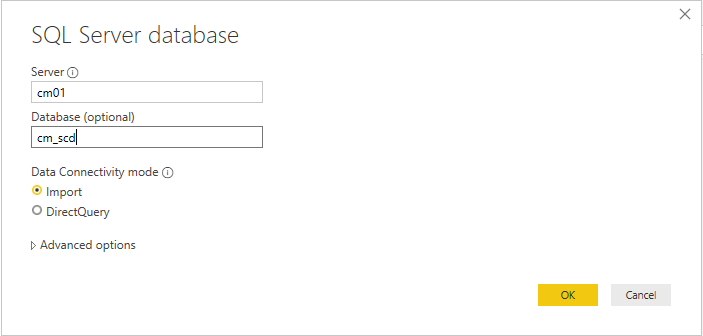
- In the SQL Server database window, enter your Server and Database name and click Ok. Wait for the connection to complete.
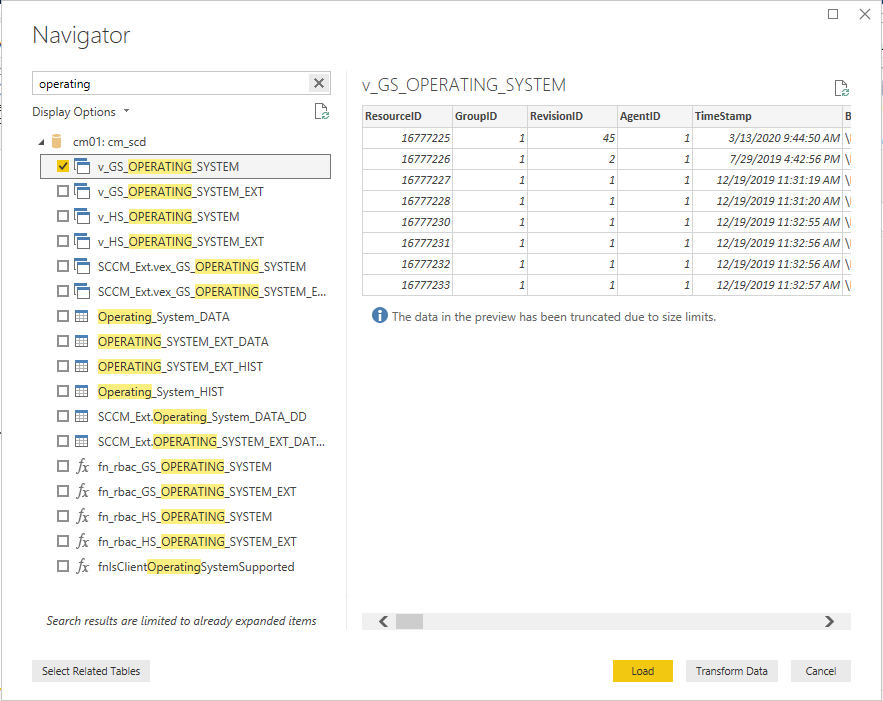
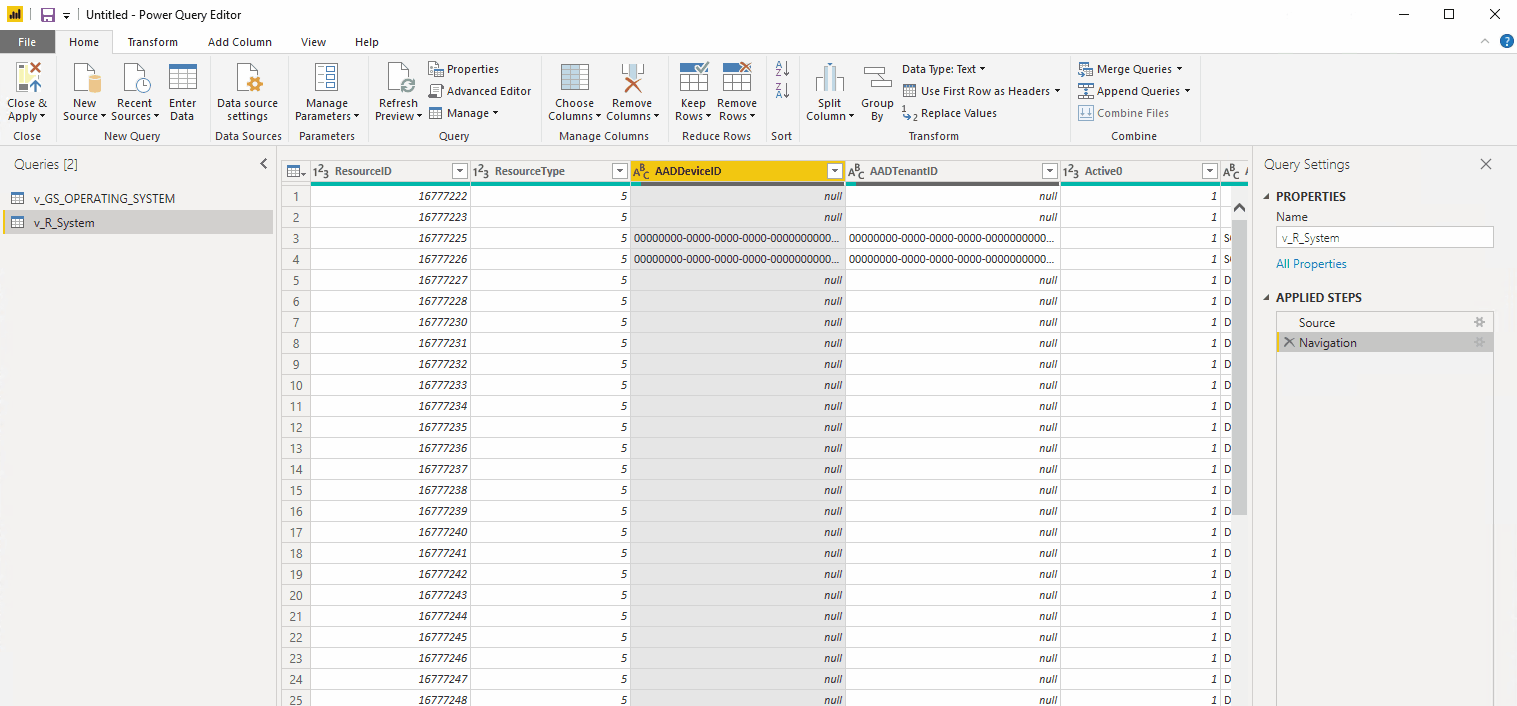
- The Navigator windows open. For our example, we’ll select the V_GS_Operating_System and V_R_System view. You can use the filter box at the top to find it. Once you selected it, you’ll see a preview of the table
- Click Load at the bottom
- You’ll be bak in the Canvas
We will now, edit our query to remove unneeded data.
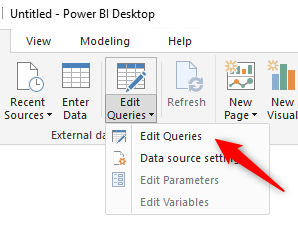
- Still in the Home tab, we’ll select Edit Queries / Edit Queries
In this screen, you can “play” with the data. You can remove unwanted data. In our example, we will remove 2 complete columns. On the left, you can undo your action and see what steps have been applied.
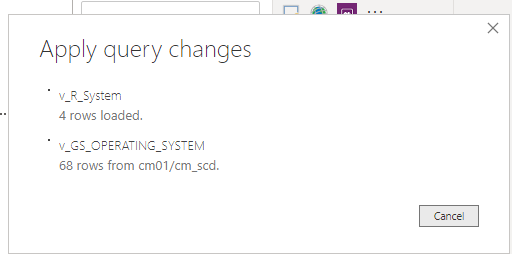
- Once completed, click Close and Apply at the top right
- The data is loading in the Power BI model
SCCM PowerBi Dashboard Creation
The fun part of building your dashboard can now begin. We’ll create a pretty basic dashboard Dashboard. The goal is more to make you understand how easy it is to build.
On the right part, you’ll find the views you just imported. You can select the needed field and the data will appear on the Canvas. You can change between charts, tables, sliders, maps, gauges, and other visualization types.
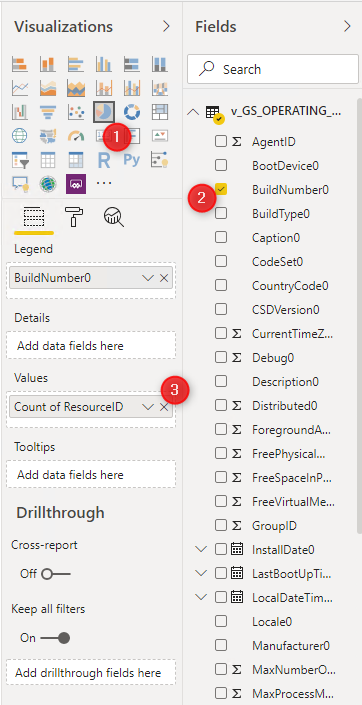
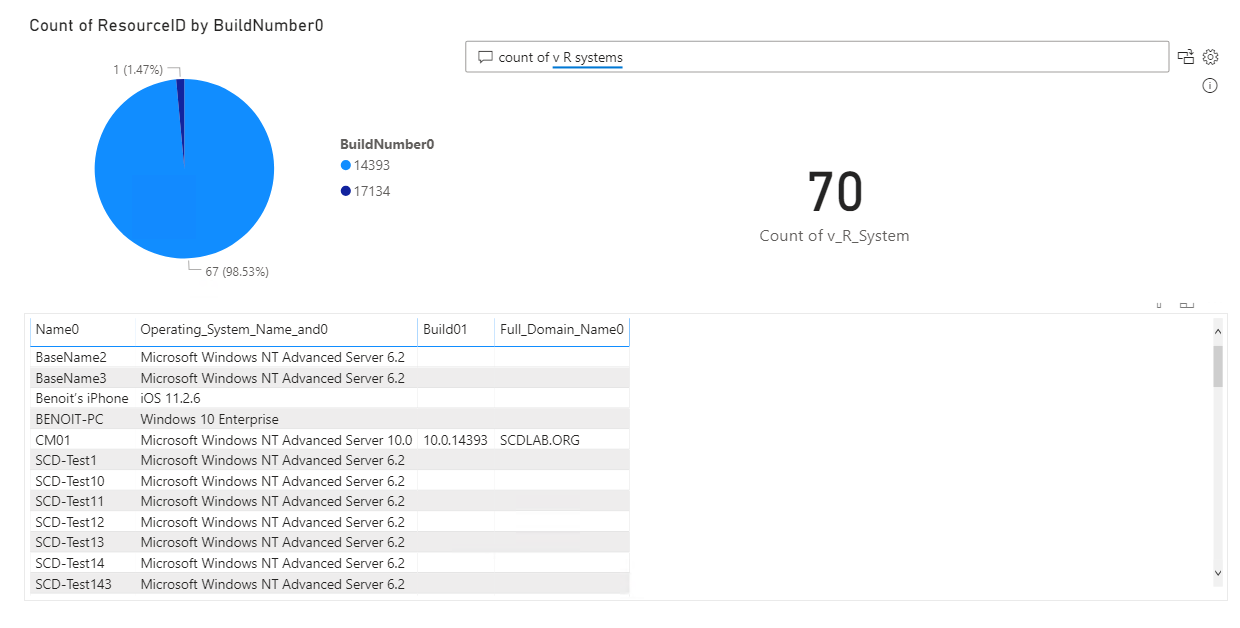
In our example, let’s begin with a chart of the OS Build Numbers.
- In the Visualizations pane, select Pie Chart
- In the Fields pane, under V_GS_Operating_System, select BuildNumber0 and ResourceID
- Back in the Visualization pane, drag down the ResourceID from Details to Values
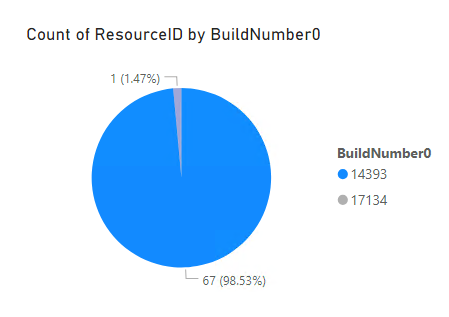
- The resulting Pie Chart appears on the Canvas
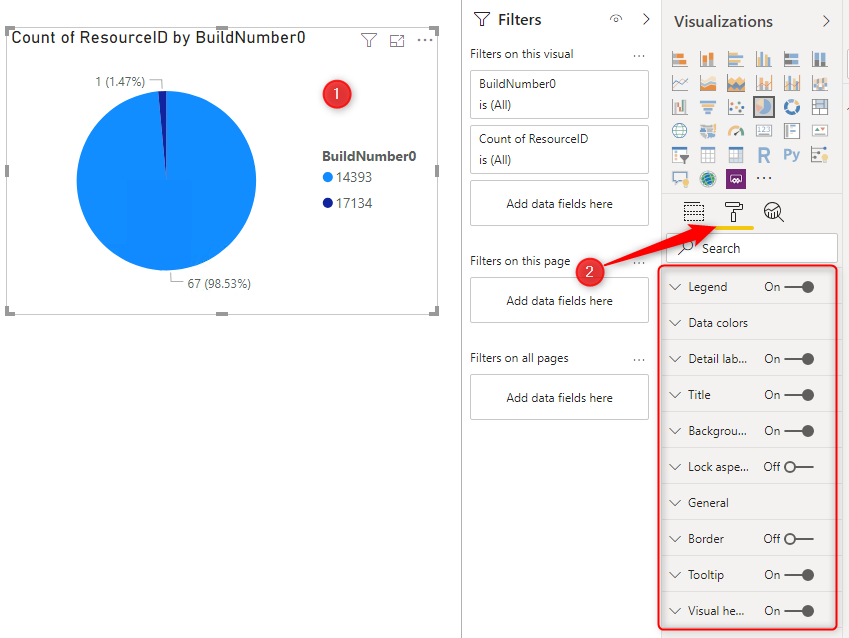
- You can change the visual of the pie chart using the options in the Visualisation pane
- Select your Pie Chart and select the paint roller brush
- From there you have various options to change the visual of the Pie Chart
Now, let’s create a table to list the device identified by the pie chart.
- Select Table from the Visualisation pane and in the V_R_System view, select Name0, Operating System, Build and Full Domain Name. All the information is populated in the table automatically
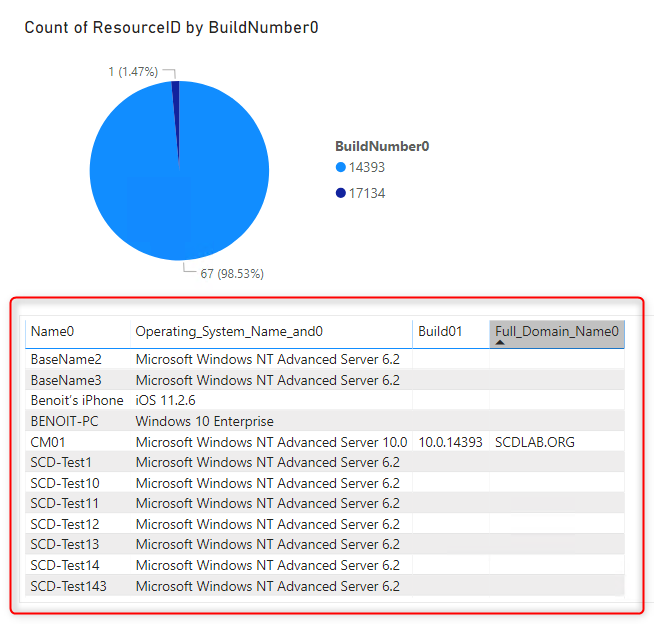
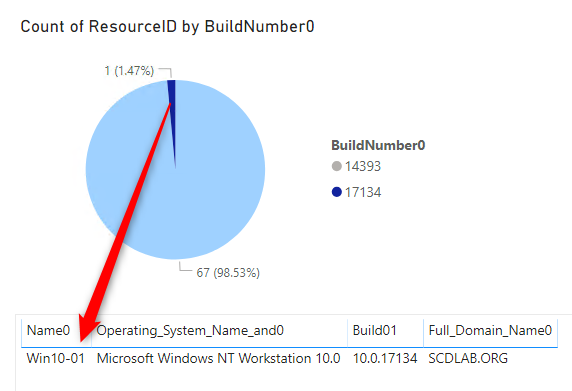
- Now, click on an area on the pie chart, let’s select the only device with BuildNumber 17134 (purple)
- The table changes automatically to display the selected device. This is where SCCM PowerBi Dashboard Creation is very cool, the data is dynamic and quick
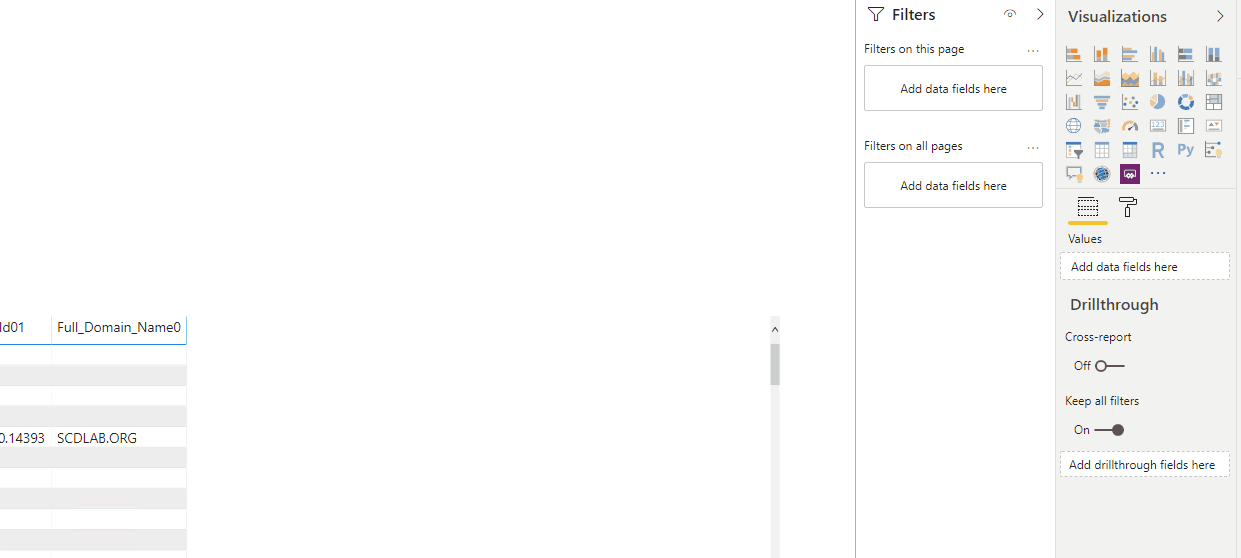
From there, your imagination is the limit. Let’s say we want our device count displayed. Let’s try that using Q&A visualization type :
- Select Q&A in the Visualisation pane
- In the Ask a question about your data enter: count of v_r_system
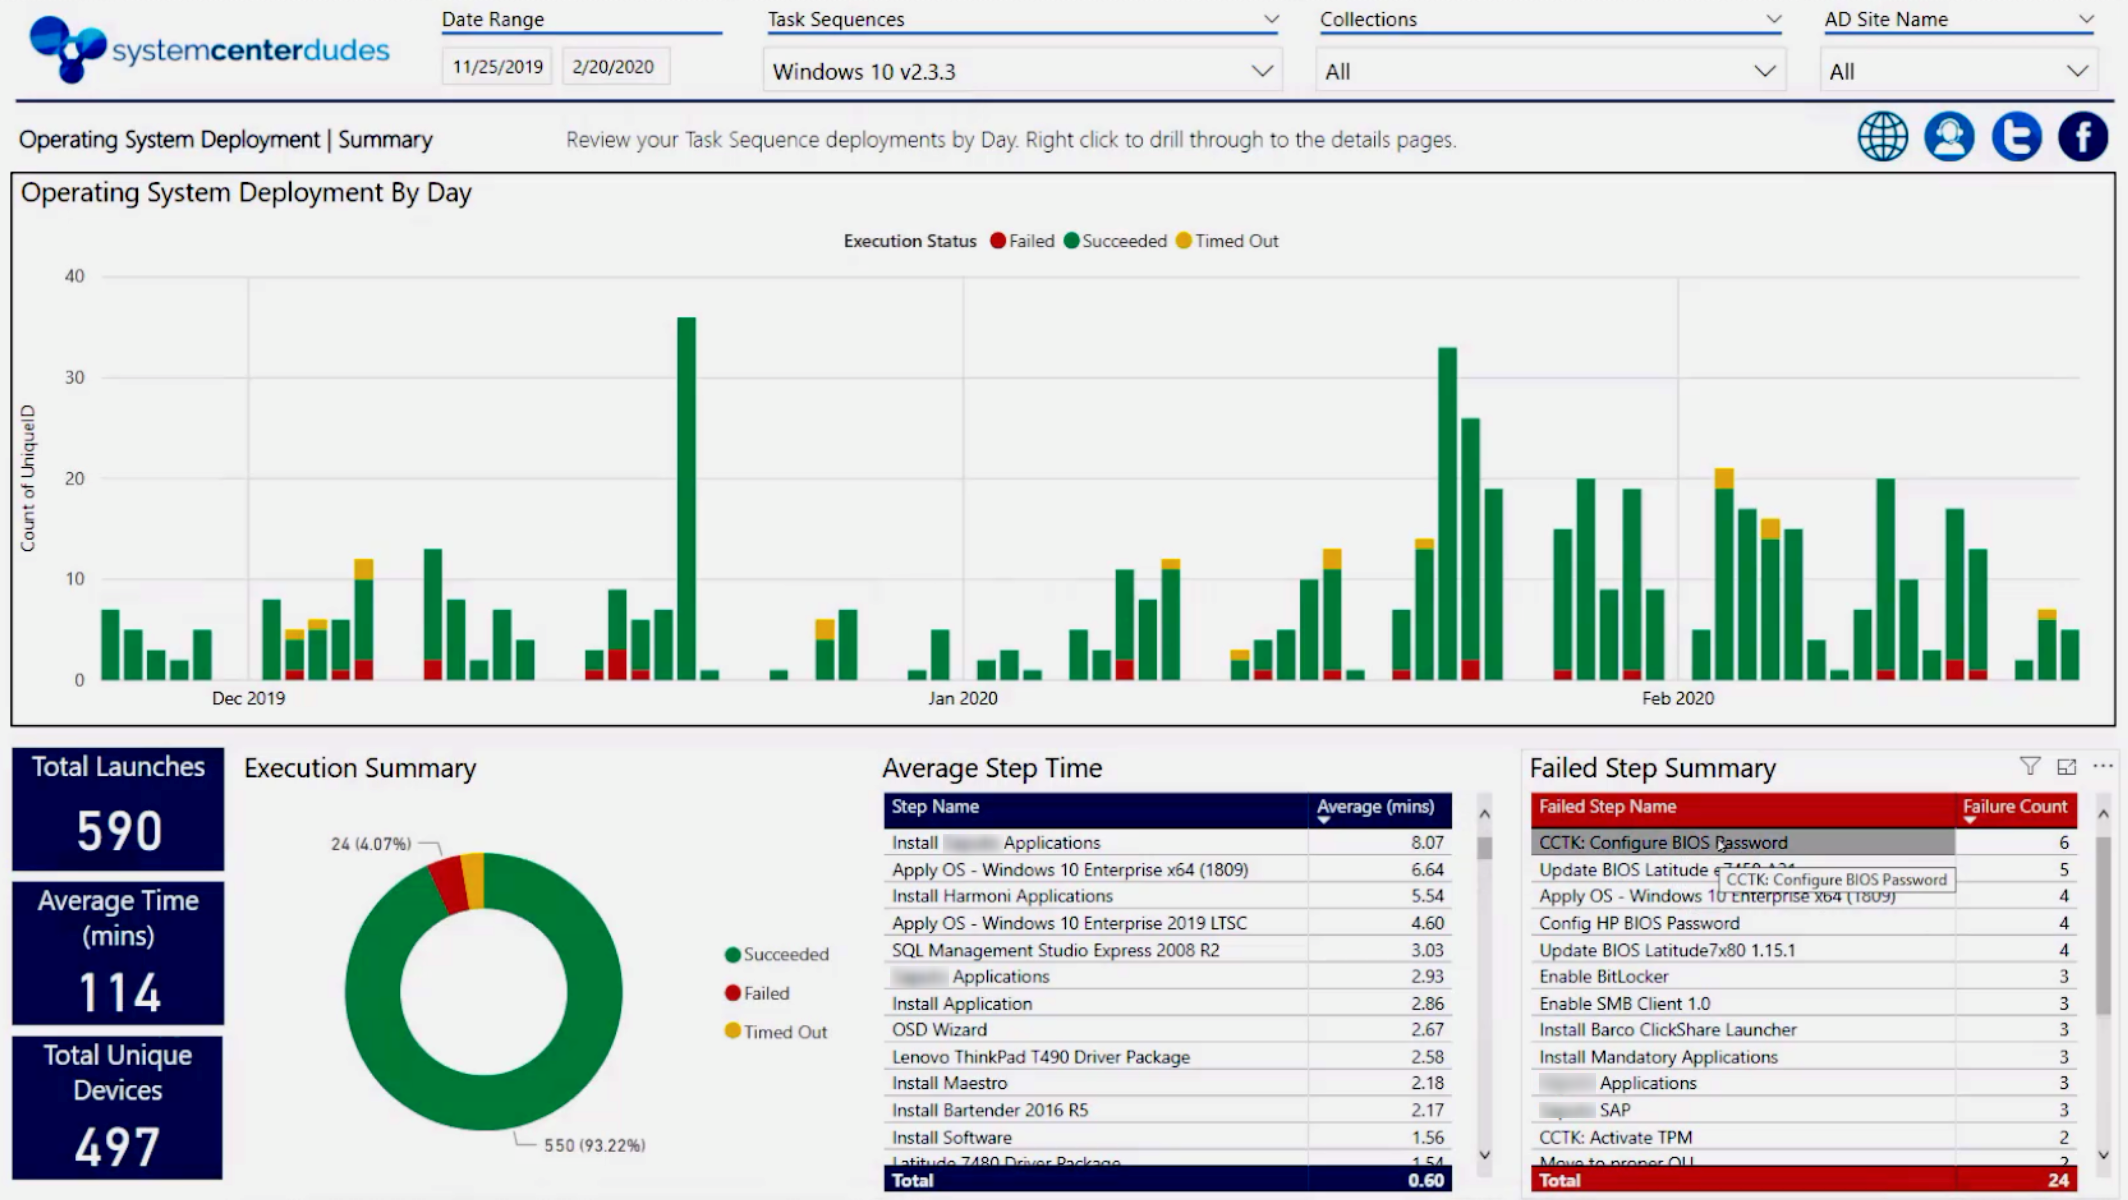
Or final Dashboard looks like this :
It’s pretty basic for now but it has been created in less than 5 minutes. It’s pretty simple to add more data. From there your imagination is the limit. The tough part is to make it look good visually as too much data may be difficult to read. Please share your best SCCM PowerBi Dashboard Creation!
Share
Get the latest insights and exclusive content delivered to your inbox


Max_L
09.22.2021 AT 01:48 AMMax_L
08.09.2021 AT 10:37 AMGuexiatreasia
04.22.2020 AT 01:49 AM