
8 Ways to Monitor Distribution Points in SCCM
Founder of System Center Dudes. Nick has been awarded in 2016 to 2019 as a Microsoft MVP in Enterprise Mobility category. Working as a senior SCCM and Intune advisor as well as a specialist Microsoft Cloud solutions specialist.

Nicolas Pilon
Vice-PresidentTable of Content
- SCCM distribution point monitoring –Console – Administration
- Console – Monitoring Site Status
- Console – Monitoring Component Status
- Console – Monitoring Configuration
- Console – Monitoring Reports
- Logs – Site System Server
- Toolkit – DP Job Manager
- System Center Dudes | System Health – Distribution Points


Share


Get the latest insights and exclusive content delivered to your inbox
Distribution Points are an important part of the infrastructure of SCCM especially if you rely on an inefficient network. Clients must able to reach them to install applications, packages, software updates, and operating systems. SCCM distribution point monitoring is an important part of your infrastructure health.
If you plan to install new distribution points in your organization, refer to our distribution point installation guide in Configuration Manager 2012. Once the installation is completed the work does not stop there, you must be sure to manage and monitor them.
Monitoring distribution points daily is required to maintain high service availability. In this post, we will explain the best ways to monitor distribution points such as:
- Console – Administration
- Console – Monitoring Site Status
- Console – Monitoring Component Status
- Console – Monitoring Configuration
- Console – Monitoring Reports
- Logs – Site System Server
- Toolkit – DP Job Manager
- System Center Dudes | System Health – Distribution Points
SCCM distribution point monitoring –Console – Administration
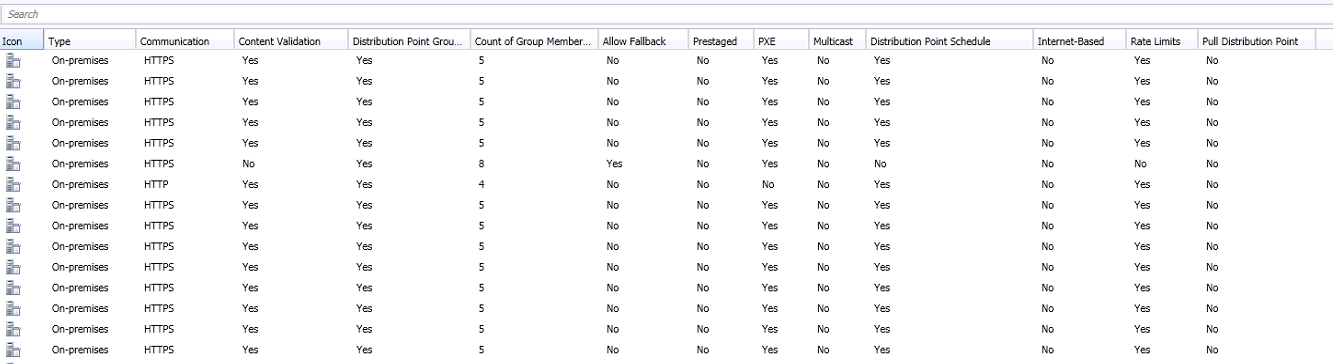
The first check you can do when analyzing some distribution points is to view the configured settings like HTTPS or HTTP, PXE, fallback, pull, internet-client based, cloud or on-premises and many more. You can detect settings modifications and ensure that distribution points are configured properly.
- From the console, navigate to Administration / Overview / Distribution Points
All the columns can be sort by. By right-clicking on the header, more options will appear.
Console – Monitoring Site Status
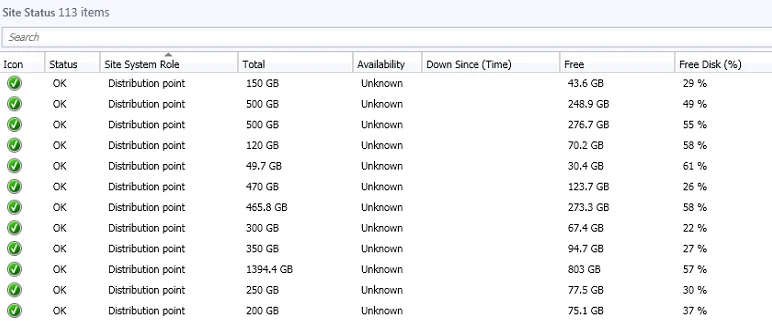
Managing space for distribution points is one of the most important features. You don’t want to be short of disk space else services like operating systems, applications, packages and software updates deployment can be impacted. Obviously, an unhealthy site system status is not good news.
- From the console, navigate to Monitoring / Overview / System Status / Site Status
- Sort by Site System Role to list only Distribution point role
Make sure Free Disk (%) has an acceptable percentage.
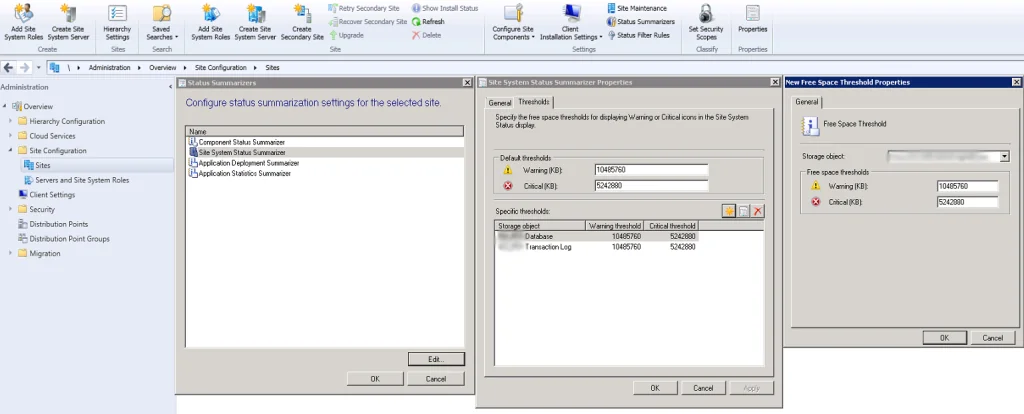
Site status is controlled by a default or desired threshold. You can modify them based on your environment.
- From the console, navigate to Administration / Overview / Site Configuration / Sites
- Click on Status Summarizers on the top ribbon
- From Status Summarizers window, click on Site System Status Summarizer and Edit
- From Site System Status Summarizers Properties, click on Thresholds tab
- Configure thresholds of your site system status
Console – Monitoring Component Status
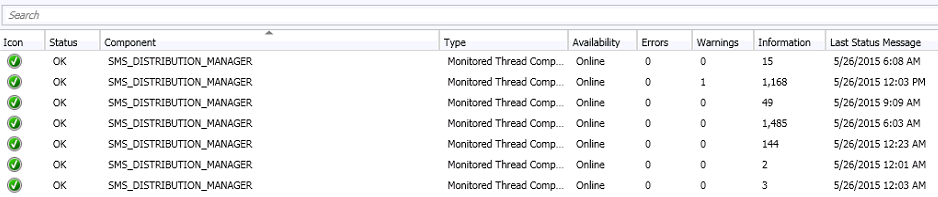
SMS_Distribution_Manager component is based on on-site servers only. A distribution point server doesn’t have this component. You can detect noise trends on the status and numbers of state messages (Errors, Warnings, Information) in this section.
- From the console, navigate to Monitoring / Overview / System Status / Component Status
- Sort by Component to list only distribution manager component
- Right-click on the specific component and select Show Messages to see more details information
Component status is controlled by the desired threshold. You can modify them based on your environment.
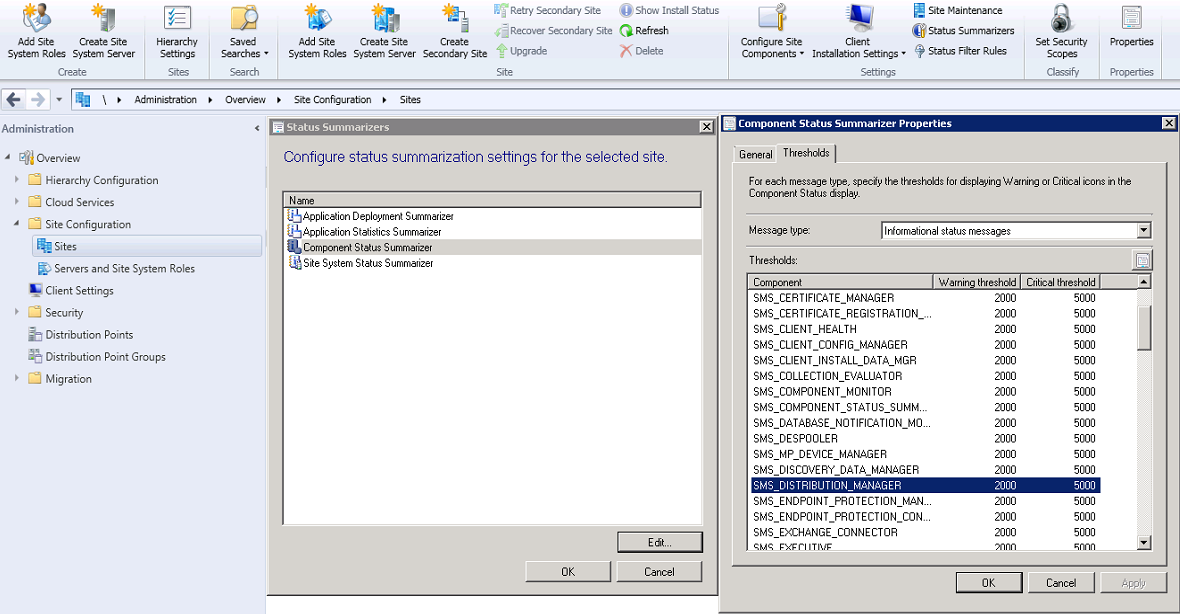
- From the console, navigate to Administration / Overview / Site Configuration / Sites
- Click on Status Summarizers on the top ribbon
- From Status Summarizers window, click on Component Status Summarizer and Edit
- From Component Status Summarizers Properties, click on Thresholds tab
- Select component SMS_Distribution_Point and configure thresholds
Console – Monitoring Configuration
Configuration Manager checks periodically the distribution point’s configuration including settings, content validation and content distribution. A distribution point can have 4 different configuration status (Success, In Progress, Warning and Error).
- To see the configuration status, from the console, navigate to Monitoring / Overview / Distribution Status / Distribution Point Configuration Status
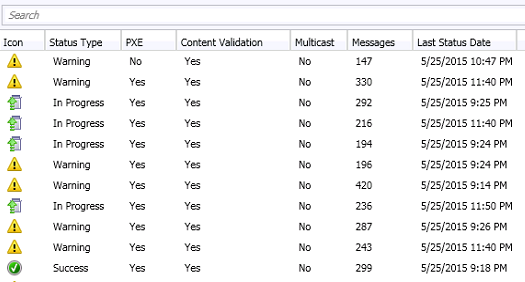
As soon there’s an issue, the warning or error icon will appear. In Progress means that there’s currently a content distribution with the distribution point. Make sure all the distribution points are healthy at all times.
For more details, you can navigate between the two below tabs (Summary and Details).
You will see the content distribution pie chart in the Summary tab.
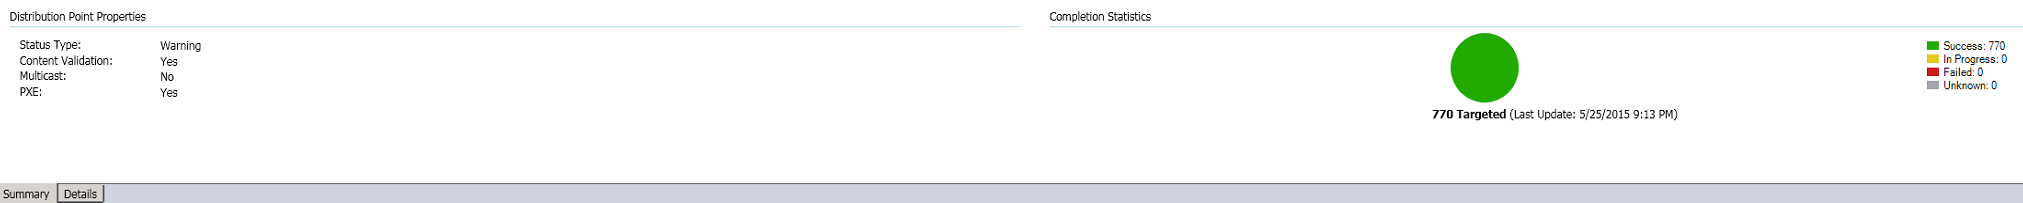
All the distribution points status messages in the Details tab.
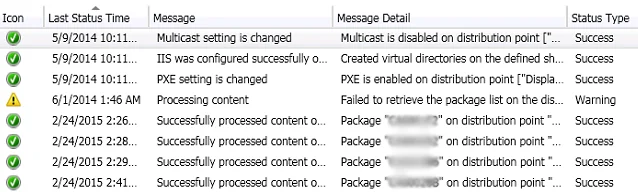
- To see more detailed information, right-click on a message and select More Details
In this case, this warning was caused by the importing package loop bug during distribution points migration.
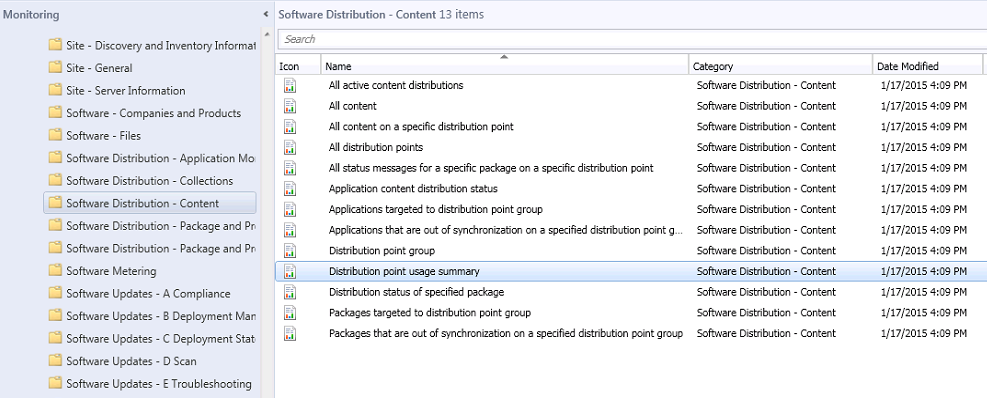
Console – Monitoring Reports
Built-in reports are available within Configuration Manager 2012. You will find some usage summary, content distribution status or even status messages reports. There’s a lot of built-in reports to fit your needs.
- From the console, navigate to Monitoring / Overview / Reporting / Reports / Software Distribution – Content
- Right-click on the specific report and click Run to execute a report
The best solution is to try them and see their potential in your company.
Logs – Site System Server
There are few logs for the distribution points component in Configuration Manager 2012. For more details, use the application CMTrace to read the logs:
- Migmctrl.log records information for shared distribution points and distribution point upgrades.
- PkgXferMgr.log records SMS Executive component for content distribution from primary to the remote site
- DistMgr.log records information about package creation, replication and software updates
The logs can be used to monitor continuously the system during troubleshooting.
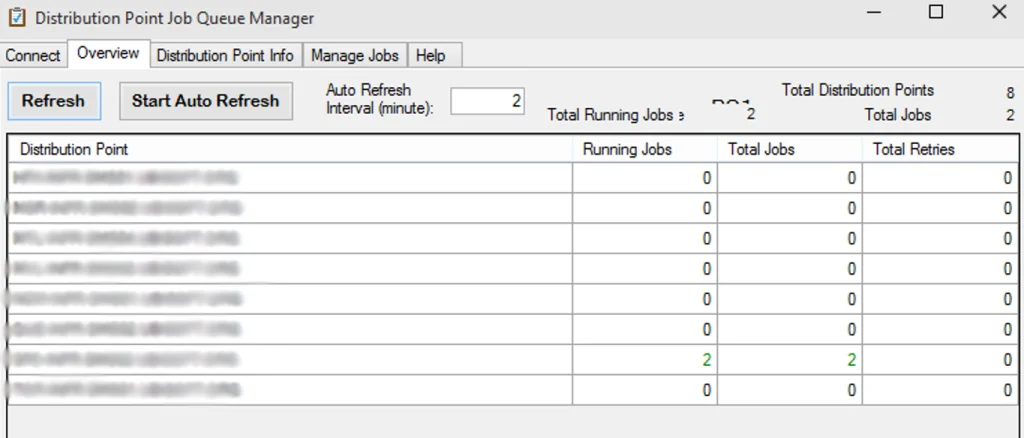
Toolkit – DP Job Manager
The DP Job Manager tool is available in the System Center 2012 R2 Configuration Manager Toolkit. It contains 15 downloadable tools to help you manage and troubleshoot SCCM 2012 R2. We will explain the DP Job Manager tool that helps troubleshoot and manage ongoing content distribution jobs.
- Download and install the toolkit
- Open DPJobMgr.exe from Server Tools installation directory
- Make sure you open with elevated rights that have access to SCCM infrastructure
- Type your primary site server name in the Connect tab
The overview tab shows current jobs for all distribution points under the selected primary server.
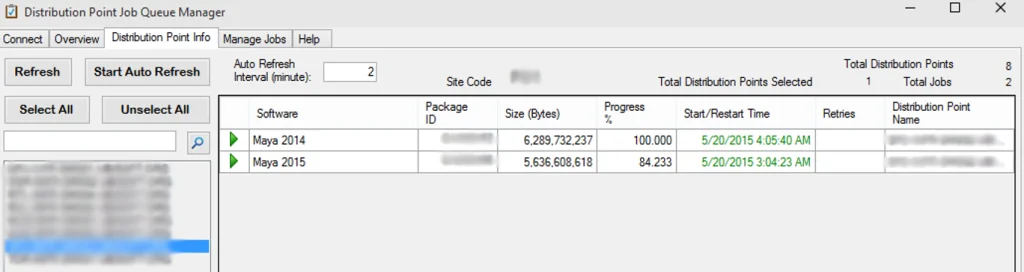
Distribution Point Info tab shows current jobs by content from the Overview tab.
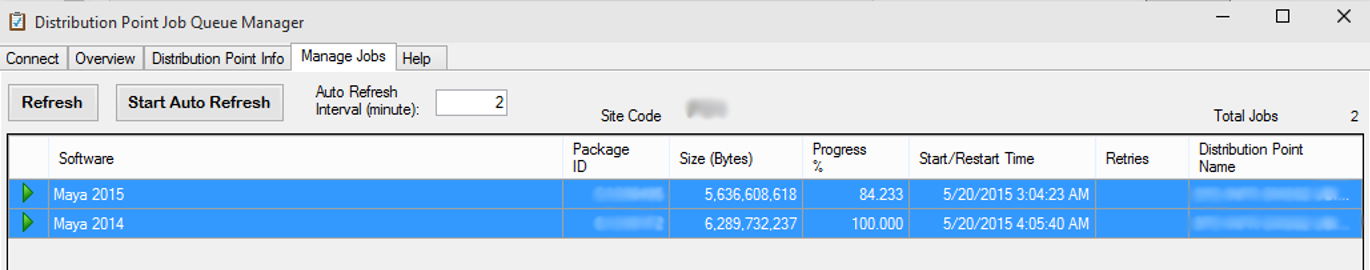
Manage Jobs tab give you the possibility to control a priority in content distribution. For more details, right-click on the jobs.
System Center Dudes | System Health – Distribution Points
This overview report will save you valuable time in your day today. With a single click, all sections of Configuration Status, Missing Content and Site Status are covered. The report is available to download and you upload the RDL file in your reporting server.
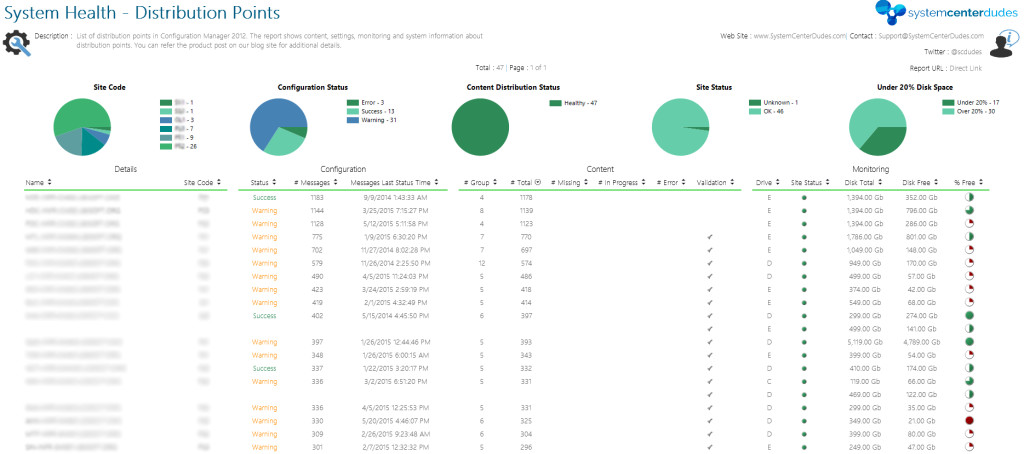
All the reports details are available here.
This sums up our article about monitoring distribution points in SCCM 2012, be sure to monitor them on a daily basis!
Share
Get the latest insights and exclusive content delivered to your inbox


Christopher Moriarty
06.22.2017 AT 12:40 PMItzikT
03.15.2017 AT 07:42 AMJoseph Martin
03.08.2017 AT 01:15 PMAnoop
12.29.2016 AT 04:04 AMRavi
05.12.2018 AT 08:38 PMAnthony Jones, IT Specialist
02.03.2016 AT 01:44 PMAnoop
12.29.2016 AT 04:03 AMNicolas Pilon
02.10.2016 AT 10:50 AM